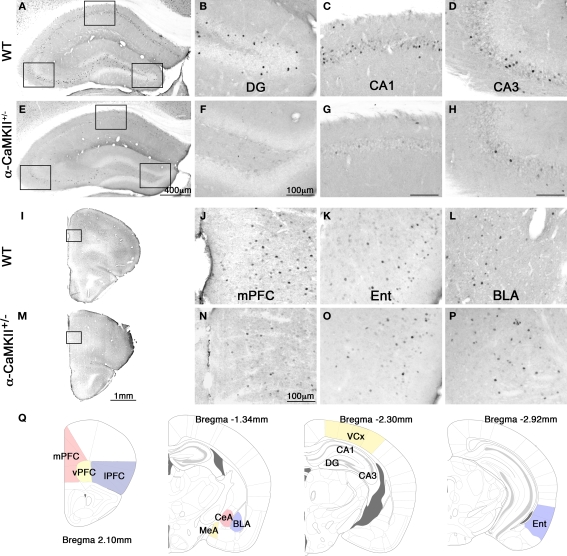
Figure 2.
Photomicrographs of c-Fos expression after the eight-arm radial maze test. Representative photomicrographs of c-Fos expression after the working memory task in the hippocampus (A), dentate gyrus (B), CA1 area (C), CA3 area (D), frontal cortex (I), and mPFC (J), entorhinal cortex (K), and basolateral amygdala (L) in the wild-type mice. Photomicrographs of c-Fos expression after the working memory task in the hippocampus (E), dentate gyrus (F), CA1 area (G), CA3 area (H), frontal cortex (M), and mPFC (N), entorhinal cortex (O), and basolateral amygdala (P) in the α-CaMKII+/− mice. (Q) Schematic drawings of mouse brain coronal sections adapted from (Franklin and Paxinos, 2008) showing the regions of interest selected for measurement of c-Fos positive cells. mPFC, medial prefrontal cortex (cingulate cortex, prelimbic cortex, medial orbital cortex); vPFC, ventral prefrontal cortex (ventral orbital cortex); lPFC, lateral prefrontal cortex (lateral orbital cortex, frontal cortex area3, agranular insular cortex dorsal and ventral part); CeA, central amygdaloid nucleus; MeA, medial amygdaloid nucleus; BLA, basolateral amygdaloid nucleus; VCx, visual cortex (primary and secondary visual cortex); Ent, entorhinal cortex (dorsolateral and dorsintermed entorhinal cortex).

