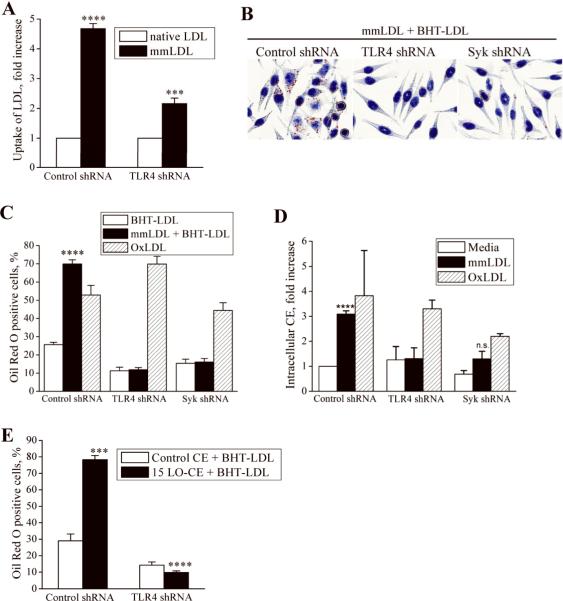
Figure 4. TLR4-dependent uptake of LDL by macrophagesin vitro.
A, Control and TLR4-knockdown J774 macrophages were incubated with 50 μg/ml of Alexa Fluor 488 labeled native LDL or mmLDL for 1 hour. The cells were fixed, gently scrapped from the plate and analyzed by FACS for the presence of intracellular LDL. Geometric means of the FACS histograms for mmLDL were normalized to that for native LDL. Mean±standard error from 3 independent experiments. ****, p<0.0001 control/nLDL vs. control/mmLDL; ***, p<0.001 control/mmLDL vs. TLR4 KD/mmLDL.
B and C, J774 macrophages, expressing control, TLR4- or Syk-specific shRNA, were incubated for 40 hours with 200 μg/ml native BHT-LDL (LDL protected from oxidation with 10 μM BHT), 50 μg/ml mmLDL plus 200 μg/ml BHT-LDL, or 25 μg/ml OxLDL alone (higher doses of OxLDL cause macrophage apoptosis). At the end of incubation, the cells were stained with Oil Red O. Images in panel B show control, TLR4-knockdown and Syk-knockdown cells incubated with mmLDL+BHT-LDL and correspond to black bars in the graph in panel C. The percentage of cells that displayed positive Oil Red O staining was determined (C). Mean±standard error from 3 independent experiments. ****, p<0.0001 control/mmLDL vs. control/nLDL.
D, J774 macrophages, expressing control, TLR4- or Syk-specific shRNA, were incubated for 40 hours with 50 μg/ml mmLDL or 25 μg/ml OxLDL, and intracellular cholesteryl ester (CE) levels were determined. Mean±standard error from 3 independent experiments. ****, p<0.0001 media vs. mmLDL.
E, J774 macrophages, expressing control or TLR4-specific shRNA, were incubated for 24 hours with 200 μg/ml native BHT-LDL (LDL protected from oxidation with 10 μM BHT) in the presence of 2.5 μg/ml of control CE or 15LO-CE. At the end of incubation, the cells were stained with Oil Red O. The percentage of cells that displayed positive Oil Red O staining was determined. Mean±standard error from 3 independent experiments. ***, p<0.001 non-oxidized CE vs. 15LO-CE in control cells.

