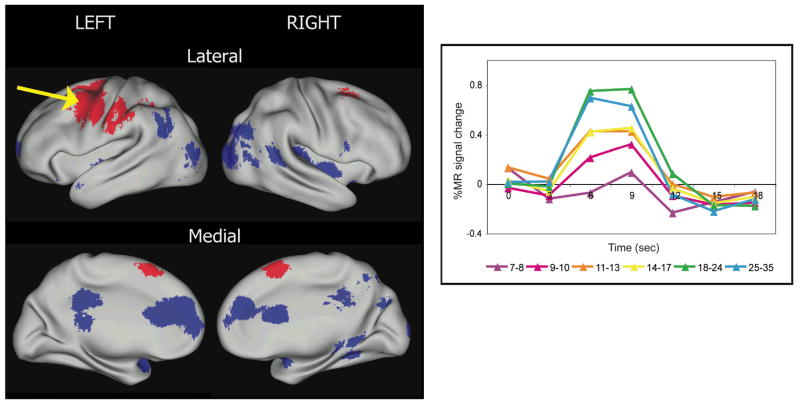
Fig. 1.
Regions that are significantly different over age across reading-related tasks (opposite generation, verb generation, and rhyme generation in auditory and visual modalities; adapted from Brown et al., 2005). Regions where activity increases over age are shown in red, whereas regions where activity decreases over age are shown in blue. The lateral surfaces of the brain images (top row) face outward, such that the posterior aspects of the brain hemispheres are closest together. The medial surfaces of the brain images (bottom row) are rotated from the lateral view, such that the anterior aspects of the brain hemispheres are closest together. The blood-oxygen level-dependent (BOLD) signal can be depicted by graphing percent signal change over time (see graph). At right, the time course for changes in BOLD signal after neural activity typically shows a peak at around 6 to 9 s and resolution at around 20 s. The average BOLD signal time courses in six incremental age bins for 81 people are shown for an example region where activity in reading-related tasks increases over age in frontal cortex (arrow). Brain activations for all figures are displayed using CARET software (Van Essen, 2005).

