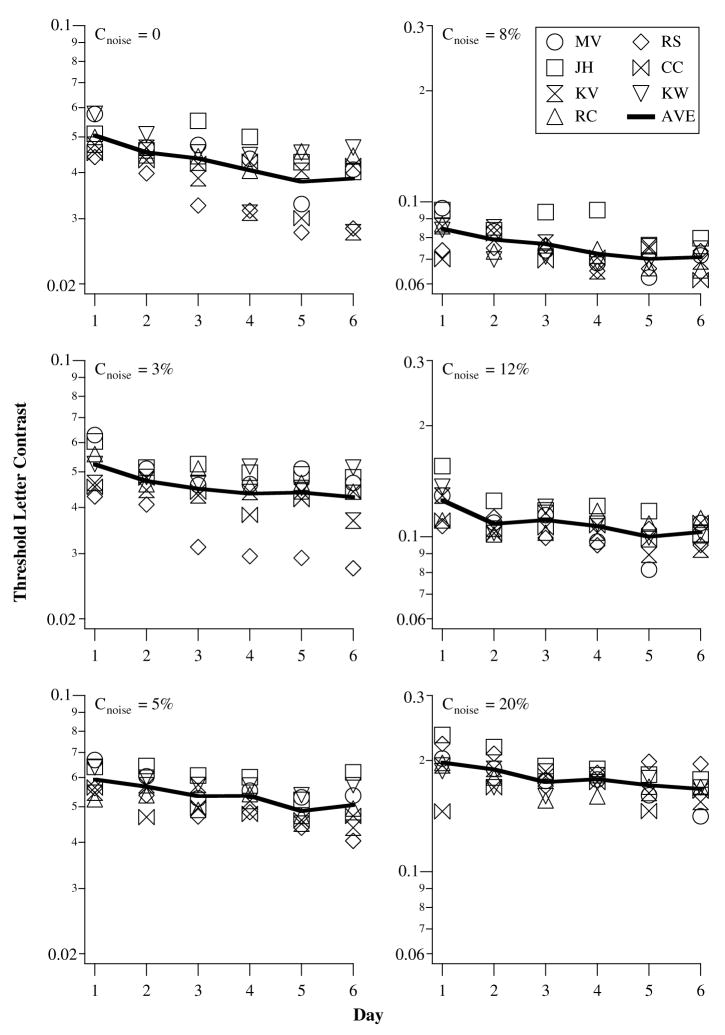
Fig. 4.
Threshold letter contrast is plotted as a function of training day, for each level of external noise contrast. In each panel, data from individual observers, as well as the group mean contrast thresholds, are shown. Note the change in the scale of the ordinate between the left and the right columns of panels.

