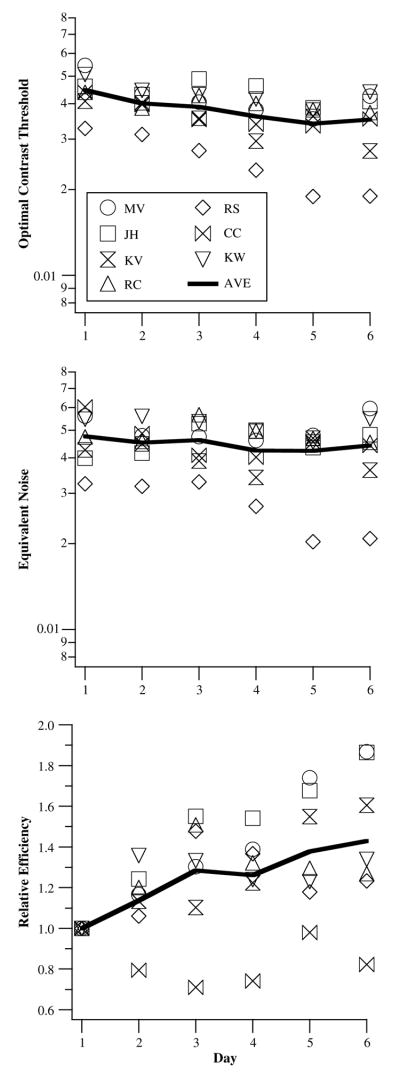
Fig. 5.
The three parameters of LAM are plotted as a function of training day: optimal contrast threshold (top), equivalent internal noise (middle) and relative sampling efficiency (bottom). Data are shown for each individual observer. Thick curves drawn through the data points represent the values averaged across the seven observers.

