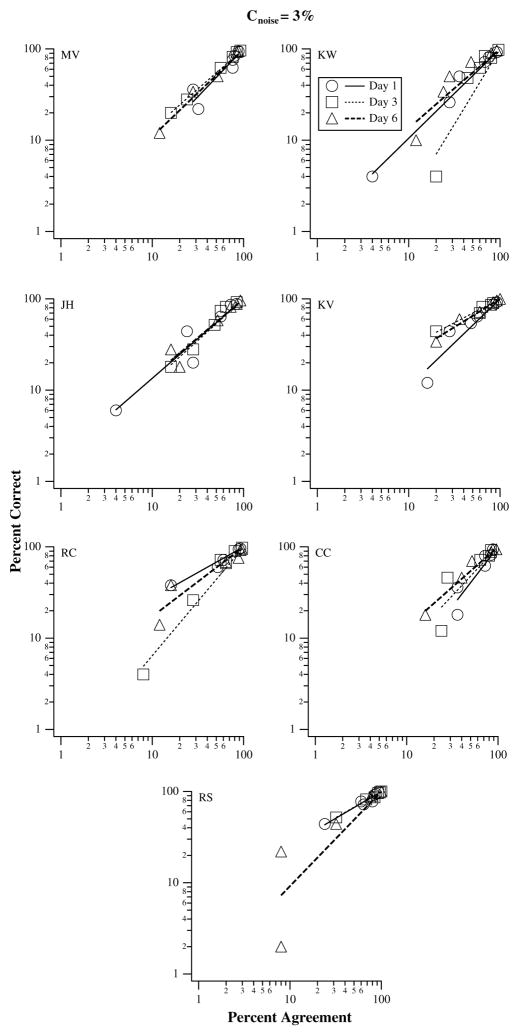
Fig. 6.
Percent-correct of letter identification is plotted as a function of percent-agreement between the two runs of the identical signal-noise combination (the double-pass method), for an external noise level of 3% contrast. Straight lines through the data-set represent the curve-fit (see text for details). If an improvement in performance is attributed to a reduction in the internal noise, then the percent-correct vs. percent-agreement function should fan out, or, the slope of the straight line should change systematically, from left to right, as learning progressed. This was not what we found.

