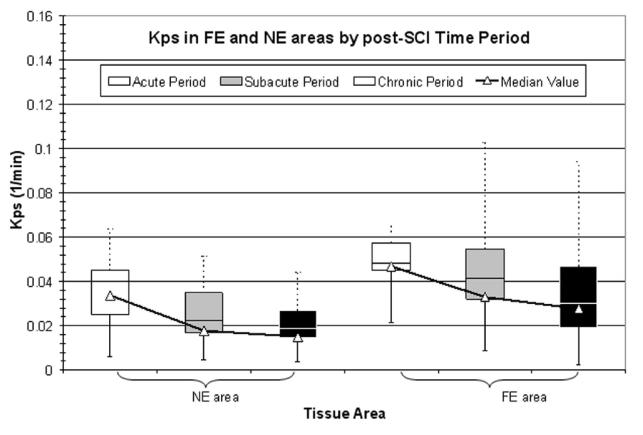
Figure 6.
Variation of Kps in NE and FE areas over time. For a given tissue area in a given time period, the upper box represents the third quartile and the lower box represents the second quartile. The upper (dotted) and lower (solid) bars represent the maximum and minimum values, respectively. The triangles represent the median values.

