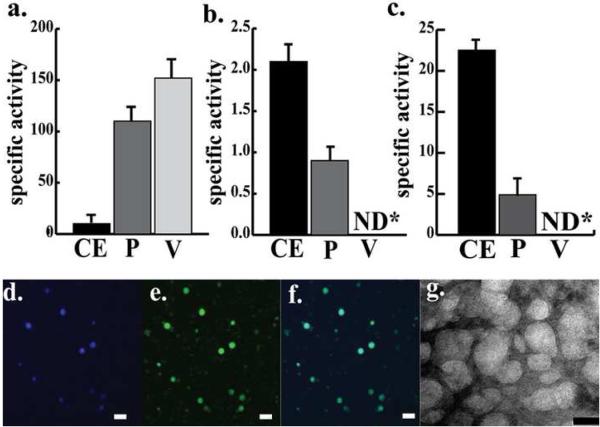
Figure 4. Analysis of purity of the vesicle-vacuole fraction.
a-c: Measurement of marker enzyme specific activities during purification of vesicles and vacuoles with protein extracts from whole cells, protoplasts and the vesicle-vacuole fraction. Protein extracts were prepared from whole cells (CE), pure protoplasts (P), and the pure vesicle-vacuole fraction (V) as described in Methods. The specific activities of alpha mannosidase (A) (vacuole marker; specific activity is expressed as nmoles of p-nitrophenol produced per min per μg of total protein), succinate dehydrogenase (B)(mitochondrial marker; specific activity is expressed as μmoles of DCPIP reduced per minute per μg of total protein and lactate dehydrogenase (C) (cytoplasmic marker; specific activity is expressed as μmoles of lactate formed in the reaction per min per μg of total protein) were measured. Data summarize three independent experiments. Specific activities are reported as the mean ± standard error. ND = not detectable. d-g: Microscopic analysis of a vesicle-vacuole fraction. The vesicle-vacuole fraction was purified and prepared for microscopic analyses as described in Methods. d-f: CLSM images of a vesicle-vacuole fraction. d: Vesicle-vacuole fraction stained with CMAC. e: Vesicle-vacuole fraction stained with MDY-64 stain. f: digital overlay of d and e. g: TEM images of the vesicle-vacuole fraction. (Bars in panels d-f = 5μm and bar in panel g = 50nm)

