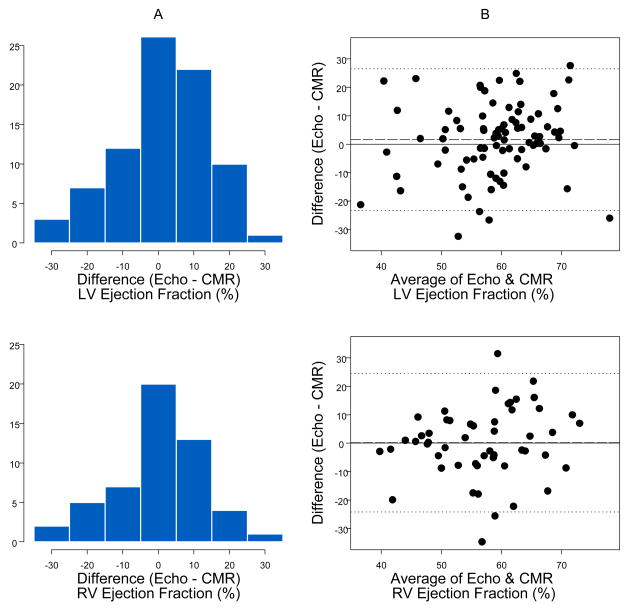
Figure 5. Comparison of Echocardiographic and CMR derived LV and RV ejection fraction.
A. Bar graphs demonstrating the frequency of differences between Echo and CMR measures of EF. B. Echo/CMR comparison for EF. Solid line indicates perfect agreement, dashed line indicates mean difference, dotted lines indicate 95% limits of agreement. CMR: cardiac magnetic resonance; LV: left ventricle; RV: right ventricle.

