Figure 1.


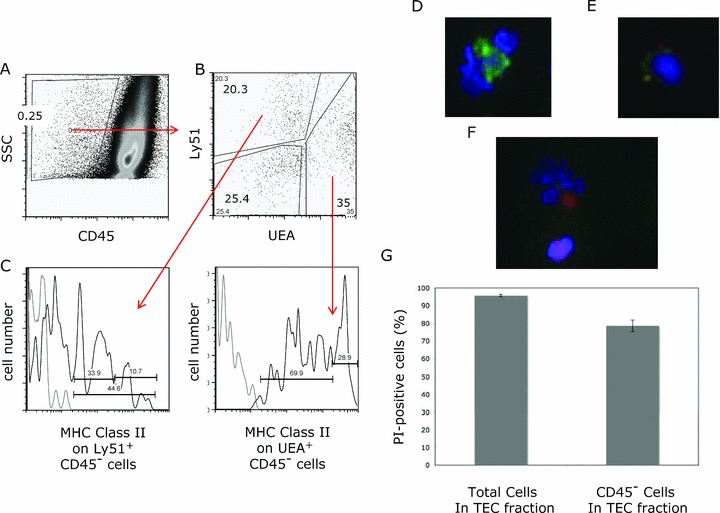
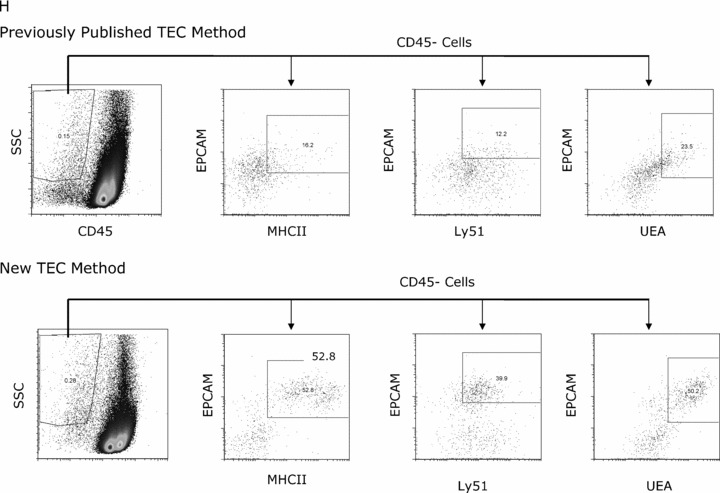
TEC subset identification by flow cytometry and immunohistochemistry. TEC populations were enumerated by flow cytometry, with medullary TEC defined as CD45− UEA+, cortical TEC as CD45− Ly51+ MHC class II+ and a triple‐negative population of CD45− UEA‐ Ly51‐. Representative flow cytometry plots are shown for (A) gating of CD45 negative population and (B) discrimination of medullary UEA+ TEC and Ly51+ populations (cortical TEC and fibroblasts) within the CD45− population, and finally (C) MHC class II staining on CD45− Ly51+ to discriminate cortical TEC from fibroblasts and CD45− UEA+ cells (MHC class II high‐proliferating population from the MHC class II intermediate population). For the MHC class II flow cytometry plot, the isotype control is light gray; MHC class II‐specific staining is black. TEC populations were directly visualized using immunohistochemical analysis of TEC preparation samples with or without CD45 column depletion. Hoechst DNA dye was utilized to identify live cells. Representative images demonstrate easily discernable single cell suspension of medullary TEC absent CD45 (red) with large nuclei (blue) UEA+ (green FITC) (D), likely cortical TEC absent CD45 (red) with Ly51+ (PE yellow) and large nuclei (blue) (E), and a thymocyte expressing CD45 (red) with small nuclei (blue) in the lower aspect of the picture with likely dendritic cell (CD45 red positive with large nuclei) in the upper portion of the picture (F). By flow cytometry, viability of the total cell population and the CD45 negative fraction within the TEC fraction using propidium iodide to discriminate dead cells is shown (graph represents four separate TEC preparations of age‐matched mice) (G). Representative flow cytometry plots are shown for comparison of the previously published TEC preparation method and the new method (H). The dot plot to the left demonstrates side scatter versus CD45; subsequent plots reveal populations within the CD45 negative fraction, showing MHC class II versus EpCAM and EpCAM+ Ly51+ (cortical) or UEA+ (medullary) TEC.
