
Figure 3.
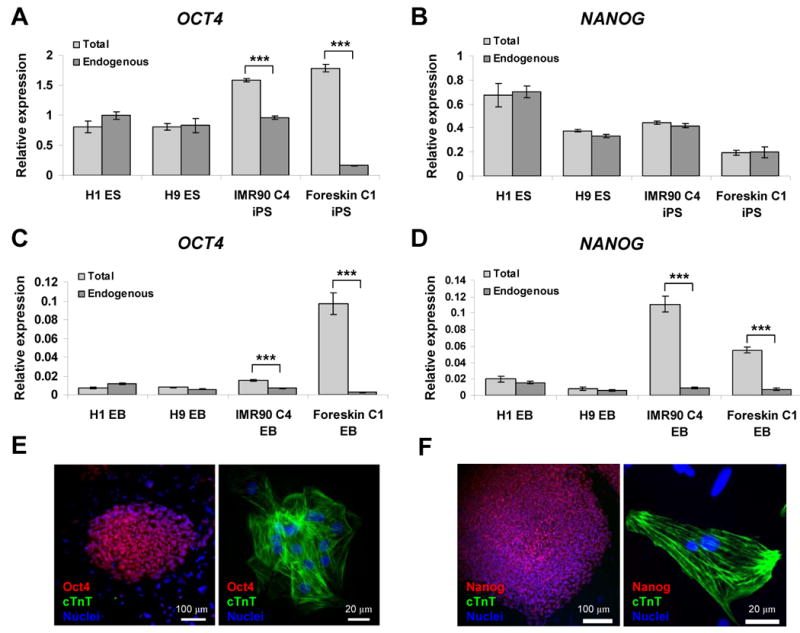
Transgene expression of OCT4 and NANOG in undifferentiated and differentiated iPS cells. Quantitative RT-PCR analyses of total and endogenous OCT4 and NANOG expression in undifferentiated iPS and ES cells (A and B), and in day 60 EB contracting areas (C and D). Error bars represent SEM (n=3), and *** indicate P < 0.001 comparing total and endogenous gene expression using t-test. (E) Double immunolabeling for Oct4 and cTnT in undifferentiated Foreskin C1 iPS cells (left panel) and Foreskin C1 iPS cell-derived cardiomyocytes from day 60 EBs (right panel). (F) Double immunolabeling for Nanog and cTnT in undifferentiated IMR90 C4 iPS cells (left panel) and IMR90 C4 iPS cell-derived cardiomyocytes from day 60 EBs (right panel).