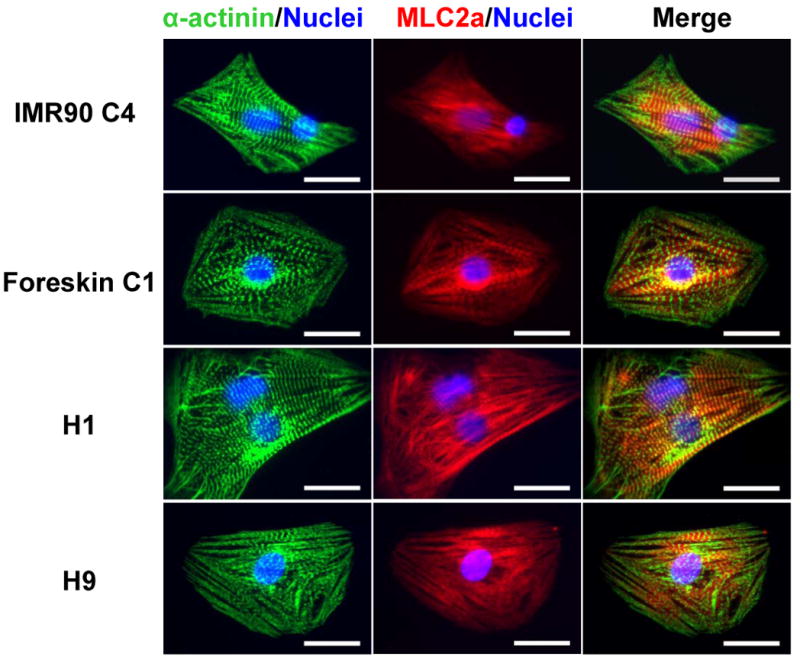
Figure 5.

Sarcomeric organization in cardiomyocytes derived from iPS and ES cells. Cardiomyocytes isolated from contracting areas of day 60 EBs from IMR90 C4, Foreskin C1, H1 and H9 were co-labeled for α-actinin (green) and MLC2a (red). Nuclei were stained with Hoechst (blue). Overlap of α-actinin and MLC2a labeling demonstrated an alternating pattern of sarcomeric labeling consistent with MLC2a present in the A band of the sarcomere between the Z-lines demonstrated by the α-actinin labeling. Scale bars are 20 μm.
