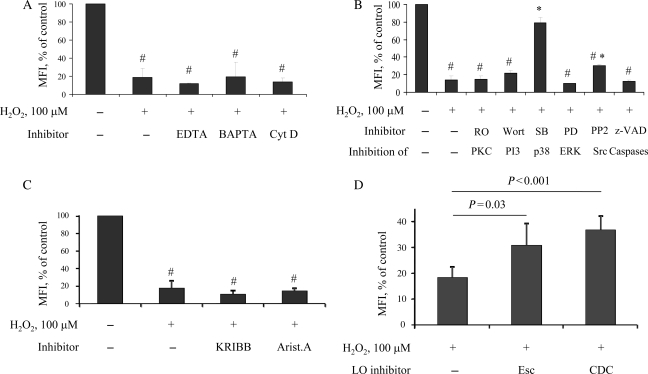
Figure 5.
Signal transduction pathways involved in ROS-induced TACE activation. Murine platelets were pre-treated with the indicated inhibitors for 15 min, and then H2O2 (100 µM) was added for 1 h. GPIbα expression was detected by FACS. The Y axis represents percentage of mean fluorescence intensity (MFI) compared with untreated cells, whose MFI was taken as 100%. #P < 0.05 vs. untreated platelets; *P < 0.05 vs. H2O2 only. (A) EDTA, 2 mM; BAPTA, 50 µM; Cytochalasin D, 5 µg/mL. (B) RO31-8220 (a PKC inhibitor), 2 µg/mL; wortmannin (a PI3 kinase inhibitor), 1 µM; SB203580 (an inhibitor of p38 MAPK), 20 µM; PD98059 (an inhibitor of ERK), 50 µM; PP2 (an Src inhibitor), 20 µM; z-VAD (general caspase inhibitor), 20 µM. (C) KRIBB3 (an HSP27 phosphorylation inhibitor), 10 µg/mL; aristolochic acid (PLA2 inhibitor), 20 µM. (D) Murine platelets were pre-treated with lipoxygenase inhibitors esculetin (40 µM) or CDC (30 µM) for 15 min, followed by incubation with H2O2 (100 µM) for 1 h; n = 6.

