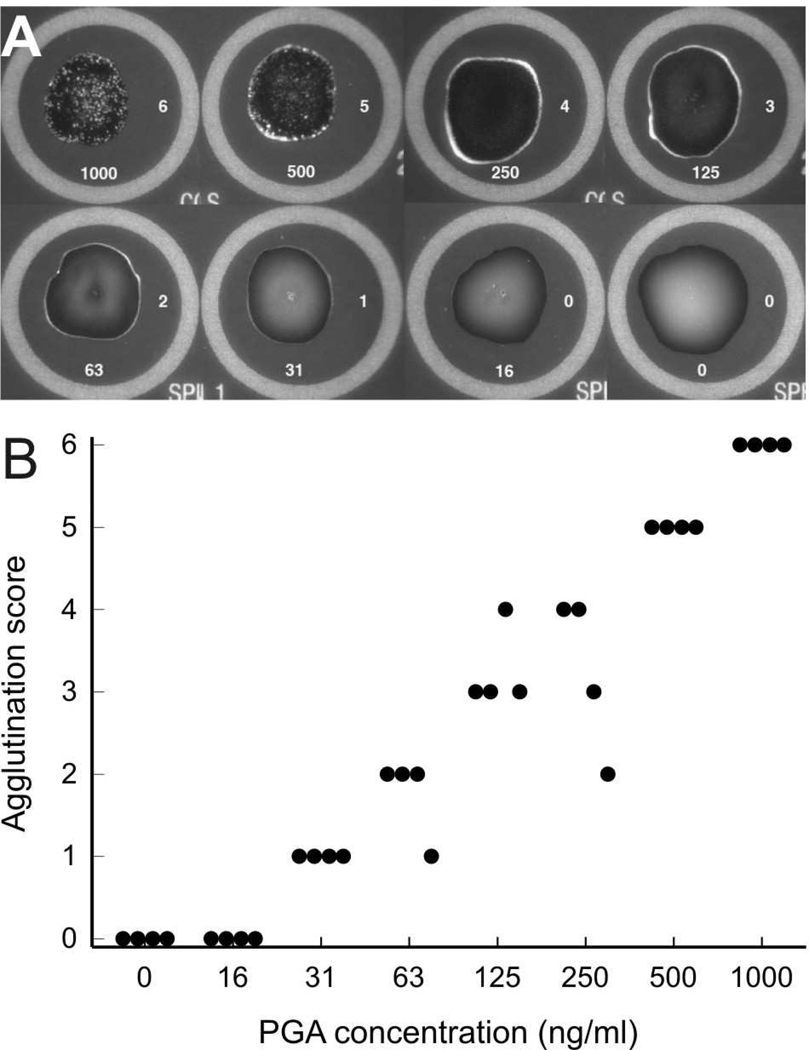
Fig. 1.
Panel A – Agglutination of latex beads coated with γdPGA MAb F26G3 by purified γdPGA. The concentration of γdPGA (ng/ml) is indicated at the bottom of each reaction mixture. The agglutination score assigned to each reaction is indicated at the right of each reaction mixture. Panel B – Agglutination reactions were scored in a blind fashion by four individuals. Scoring was based on the images shown in Panel A. Results of scoring for γdPGA at various concentrations by individual readers is shown for each γdPGA concentration.

