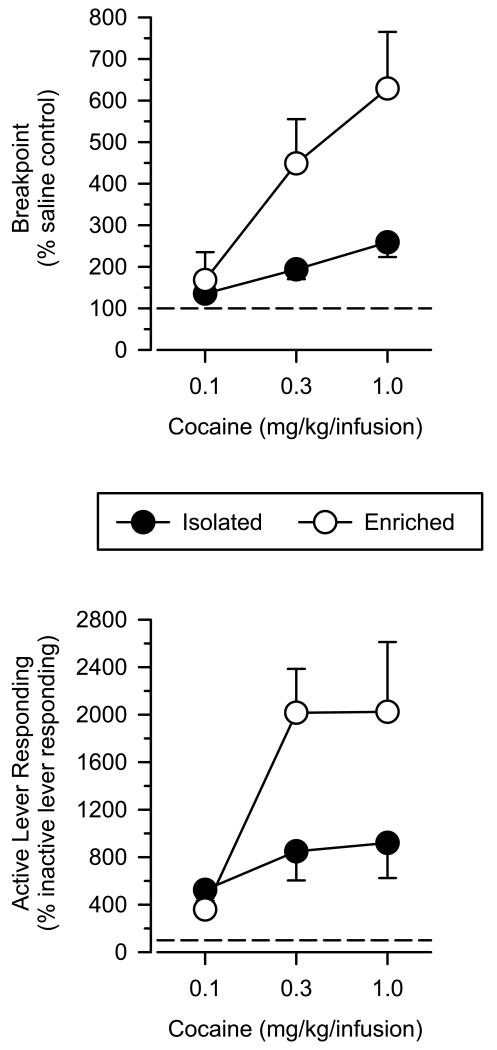
Fig. 3.
Cocaine self-administration in isolated and enriched rats (mean ±SEM). Upper panel: breakpoints expressed as a percentage of saline control values when responding was maintained by various doses of cocaine. Lower panel: active lever responding expressed as a percentage of inactive lever presses when responding was maintained by various doses of cocaine.

