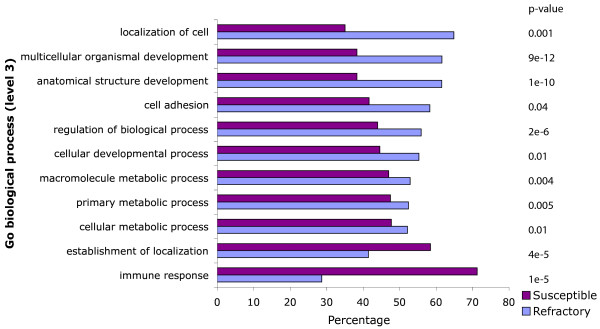
Figure 6.
GO categories enrichment and depletion in susceptible and refractory regions. Over-and under-represented GO categories (biological process, level 3 only) for genes localized within susceptible and refractory regions. The adjusted p-values were obtained with a two-sided Fisher test using the Fatigo function from the Babelomics platform.

