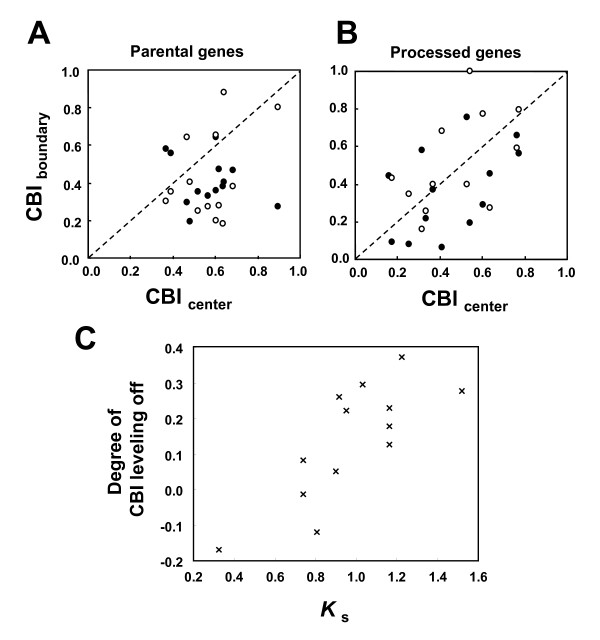
Figure 5.
Comparisons of processed genes and their parental genes. Comparisons of internal coding exons longer than 45 full codons in the parental gene and their paralogous exonic regions in the intronless processed genes in D. melanogaster. Relationship between codon bias index (CBI) of the center and the intron-exon boundary regions (15 full codons from the junction) among the internal exons of the parental gene (A), and their corresponding exonic regions in the processed genes (B). Closed and open circles indicate values of 5' and 3' boundary regions, respectively. Relationship between Ks estimated from the whole gene [54] and the degree of CBI leveling off, namely [Δ-CBIcentral-boundary]parental gene – [Δ-CBIcentral-boundary]processed gene (C). A positive correlation was observed between these values (r = 0.75, P < 0.01, Spearman's rank order correlation; N = 13).

