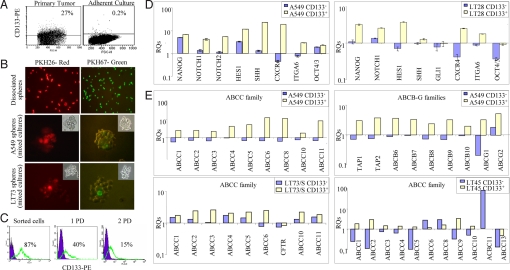
Fig. 3.
In vitro characterization of CD133+ cells. (A) FACS analysis for CD133 expression in freshly dissociated primary LT73 and corresponding adherent cell culture after four passages in vitro. (B) PKH26 staining of LT73 and A549 spheres. (Top) Single cells from dissociated spheres were separately labeled with PKH26 and PKH67 red and green fluorescent dyes, and cultures were harvested by mixing red and green labeled cells. (Middle and Bottom) A549 (Middle) and LT73 (Bottom) spheres, derived from mixed cultures, showed a separate green or red fluorescent staining, with a decreasing gradient of fluorescence intensity within the spheres. Microscopic images of spheres derived from labeled cells were acquired at 20× magnification in bright field, with rhodamine filter for PKH26 fluorescence (Left) and with fluorescein filter for PKH67 fluorescence (Right). (C) Time-course analysis of CD133+ cells sorted from A549 spheres. FACS analysis of CD133 after sorting and at the first and second population doubling (PD). (D) Real-time PCR analysis of stemness gene expression in CD133+ and CD133− fractions, sorted from LT28 xenograft (Left) and A549 spheres (Right). Unsorted cells were used as calibrator for the relative quantification of gene expression. (E) Real-time PCR analysis of transporters of ABCC-B-G families in CD133+ and CD133− cells sorted from A549/s, and ABCC family in CD133+ and CD133− cells sorted from LT73/s and LT45 xenograft. Unsorted spheres or LT45 unsorted cells were used as calibrators for the relative quantification of gene expression.

