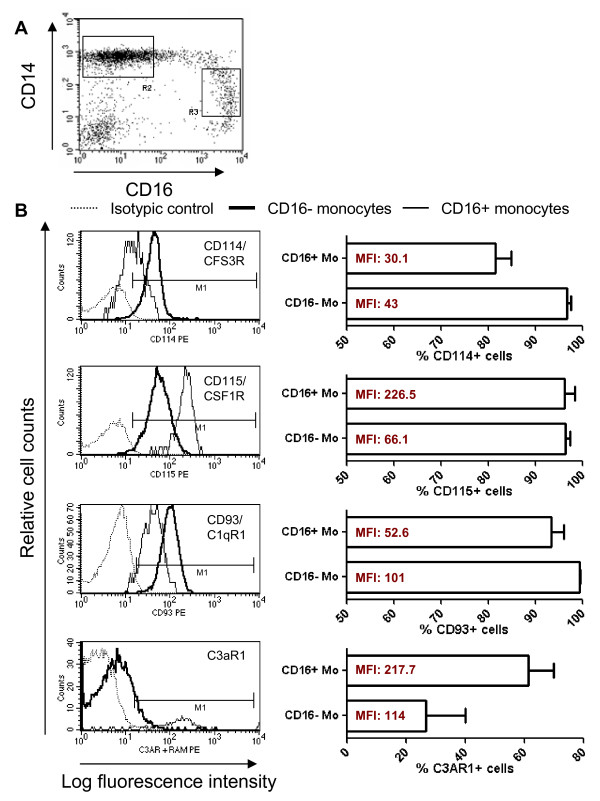
Figure 3.
Differential expression of CD114/CSF3R, CD115/CSF1R, CD93/C1qR1 and C3aR1 on CD16+ and CD16- monocytes. Freshly isolated PBMC were stained with FITC CD14, PE-Cy5 CD16, and PE CD114, PE CD115, and PE CD93 Abs. The expression of CD3aR1 was detected after staining with unconjugated mouse C3AR1 Ab and PE rat anti-mouse Ab (RAM). CD14highCD16neg (R2) and CD14lowCD16+ (R3) Mo (A) were analyzed for expression of CD114, CD115, CD93 and C3aR1 (B). Shown is an overlay histogram from one representative donor of 4 donors examined (B, left panels) and graphs showing mean ± SEM for % or MFI of CD114, CD115, CD93 and C3aR1 expression on each Mo subset (B, right panels). (*, Paired t-test p-value < 0.05, CD16+ versus CD16- Mo; n = 4).

