
Figure 6. V. harveyi Bioluminescence in Response to Antagonists.
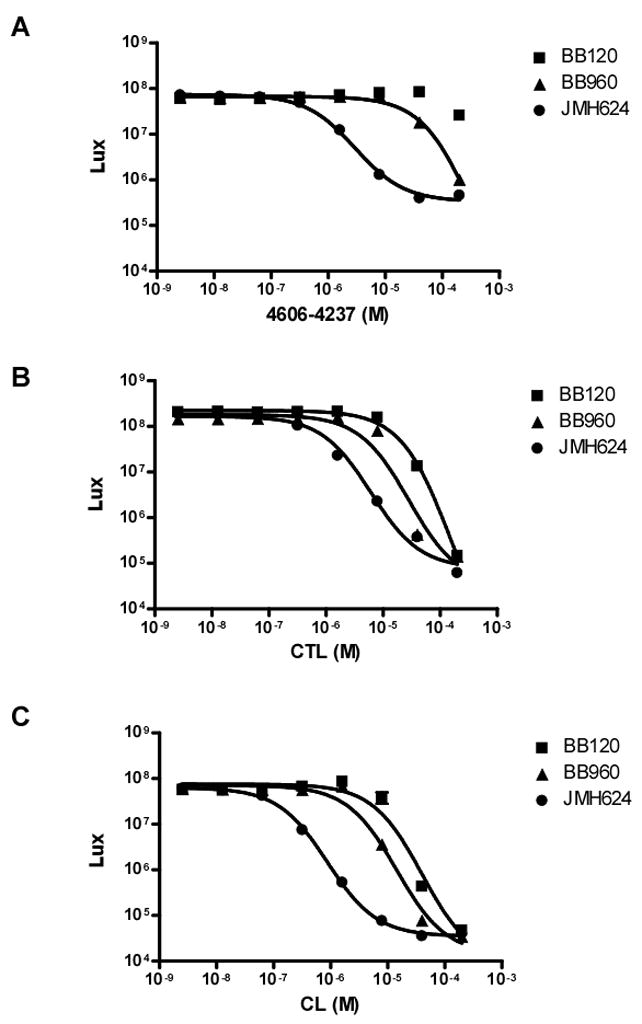
Light production from wild type V. harveyi (BB120), a luxPQ mutant (BB960), and a luxPQ, luxM double mutant (JMH624) was measured in the presence of the specified concentrations of 4606-4237 (A), CTL (B), or (CL) (C). Data were fit with a variable-slope sigmoidal dose-response curve to determine IC50 values. Error bars although small are included and represent the standard error of the mean for three independent trials.