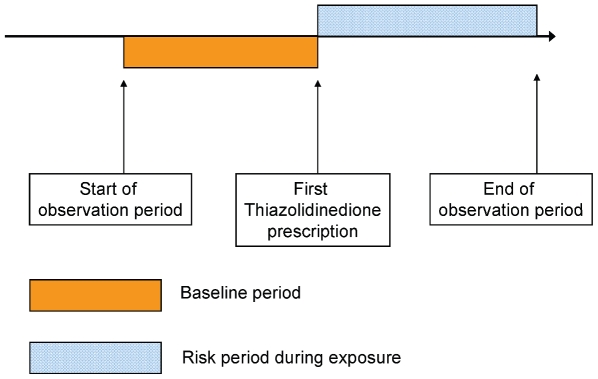
Figure 1. Representation of study design.
The figure illustrates a single individual prescribed a thiazolidinedione during their observation period. All participants included in the analysis had at least one prescription for a thiazolidinedione and at least one fracture. The rate ratios presented are pooled estimates derived from the rate of events during the risk (exposed) periods divided by the rate of events during the baseline periods. Age is adjusted for at all stages of the analysis.

