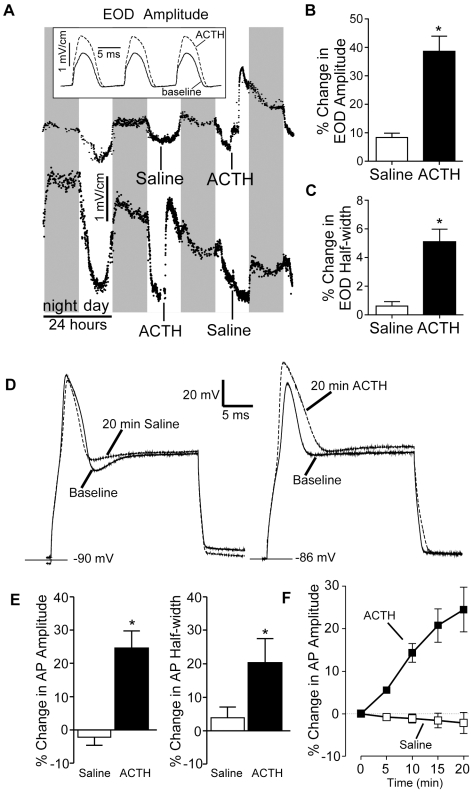
Figure 4. ACTH increases EOD amplitude in vivo and electrocyte AP amplitude in vitro.
(A) Injections of ACTH increased EOD amplitude whereas saline injections have little or no effect. Plots show EODs recorded from two fish that received counterbalanced injections of saline or ACTH at midday. Inset: superimposed representative EOD waveforms taken at baseline and 1 h after ACTH injection. (B, C) Percentage increase in EOD amplitude and half width following injections of saline or ACTH injections. Bars show means, and error bars indicate SEM. (D) Representative traces of APs recorded at baseline and after 20 min exposure to saline (control) or ACTH. (E) In cells exposed to ACTH, AP amplitude and half width increased compared to saline controls. Both experimental and control cells showed slight but similar increases in input resistance (unpublished data). Asterisks indicate conditions different from saline control (unpaired t test, p<0.05). (F) Time course of ACTH-induced increase in AP amplitude.

