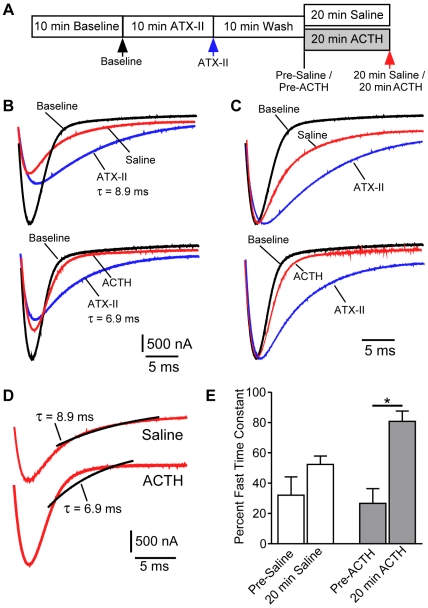
Figure 10. ACTH promotes recovery of fast INa inactivation following ATX-II treatment.
(A) Schematic experimental timeline indicating points of INa measurement represented in Panels B–E. Color-coded arrowheads correspond to the colors of representative traces shown in B–D. (B) Representative peak magnitude INa traces at baseline, after ATX-II saturation, and after washout of ATX-II followed by 20 min exposure to saline (top) or ACTH (bottom). Potassium currents were blocked in all conditions by addition of 60 mM TEA. (C) Same traces as in (B), but current amplitudes are normalized to baseline to facilitate direct comparison of the inactivation phase in each current. (D) Current traces following 20 min treatment with saline or ACTH treatment taken from Panel B. Black lines represent the best possible single exponential fit using the slow inactivation time-constant from the corresponding ATX-treated traces. The slow time-constant better accounts for inactivation in the saline treated cell. (E) After washout of ATX-II, τfast accounts for approximately 25% of INa inactivation in all cells prior to 20 min exposure to saline or ACTH. After the 20 min experimental manipulation, the fast component of INa inactivation shows greater recovery in cells treated with ACTH than in saline controls (F [3,12] = 7.612, p<0.01; pairwise comparison significantly different p<0.01 by Tukey's HSD).

