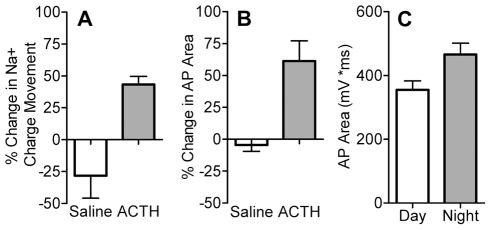
Figure 11. Increased Na+ influx during the enhanced electrocyte AP.
(A) Total Na+ charge movement during peak INa recorded in voltage clamp increases by 43%±6% after treatment with ACTH but decreases by 28%±17% in control cells (t = 4.68, df = 9, p<0.01). (B) Treatment with ACTH increases area under the AP by 61%±16%, compared to a 5%±5% decrease in controls (t = 4.20, df = 13, p<0.001). (C) Area under the AP is greater in electrocytes harvested at night than in day-harvested electrocytes (t = 2.55, df = 10, p<0.05).

