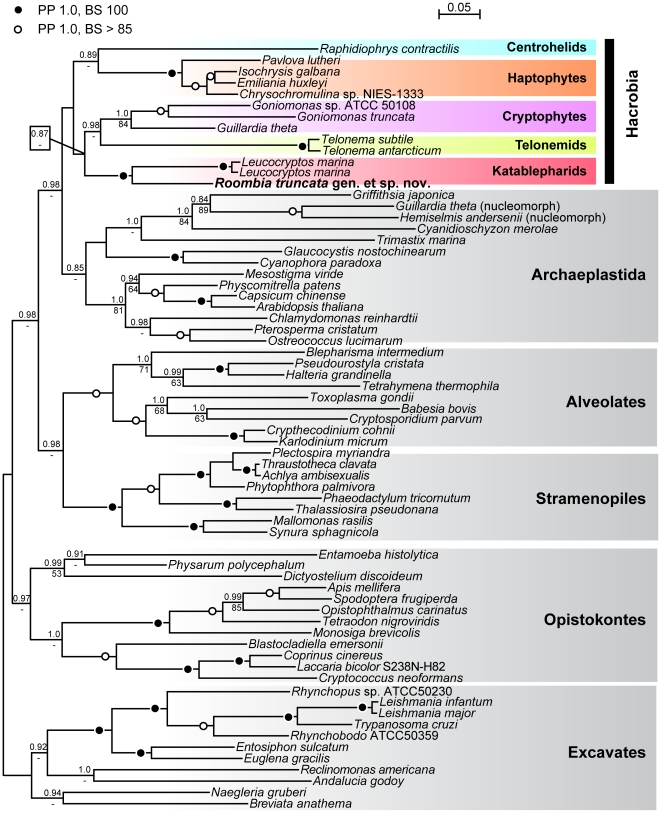
Figure 5. Molecular phylogeny based on Hsp90.
The maximum likelihood (ML) topology based on Hsp90 sequences constructed using RTREV+GAMMA+F model of evolution. Black circles denote the branches supported by posterior probability (PP) of 1.0 and bootstrap support (BS) of 100. Open circles denote the branches supported by PP of 1.0 and BS higher than 90. BS was inferred from 1000 replications using RAxML 7.0.4, PP were assessed from 106 generations with MrBayes 3.1.2 (see Methods part for details). Supergroups are boxed and shaded different colours, numbers at nodes.

