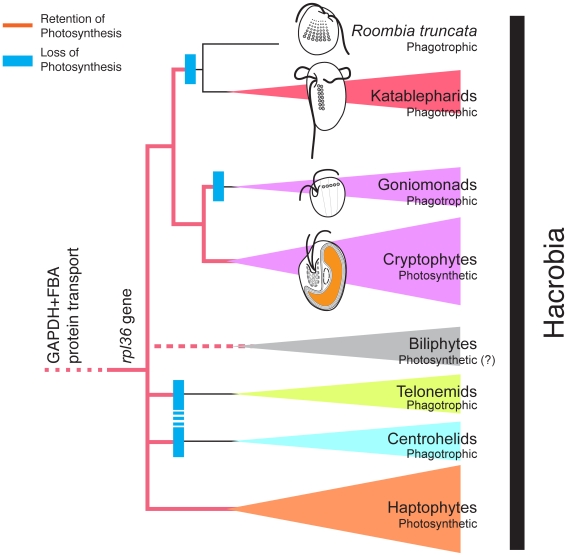
Figure 7. Schematic diagram of Hacrobia.
Red lines denote the retention of photosynthesis. Blue boxes denote the losses of photosynthesis. If the monophyly of telonemids and centrohelids is the case as was suggested in Burki et al. [29], the number of losses of photosynthesis may be three, instead of four.

