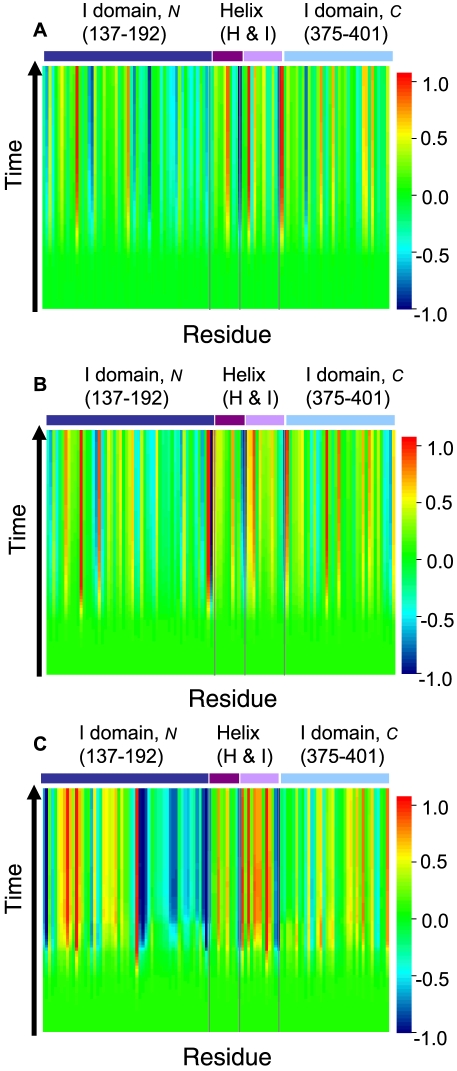
Figure 3. The trajectories of time dependent dynamic responses of residues in the chaperone complex.
Responses are calculated using (A) the T state conformation (pdb 1oel), (B) the R state conformation (2c7e), and (C) the R″ state conformation (1aon) of the chaperon complex structures. For clarity, only time trajectories for the N-terminus of the I domain, the helices H and I in the A domain, and the C-terminus of the I domain are plotted. The  -axis represents the numbering of residues in sequence, and the
  axis indicates the time scale. The value of the probability flow is color coded at different
  scale. The color coding scheme (shown in the side bar) is derived from a linear transformation of the probability flow: The initial probability value is set at
  , and either the maximum or the minimum among all residues at all time scale, whichever has the largest absolute value, is scaled accordingly to
  or
or  .
.

