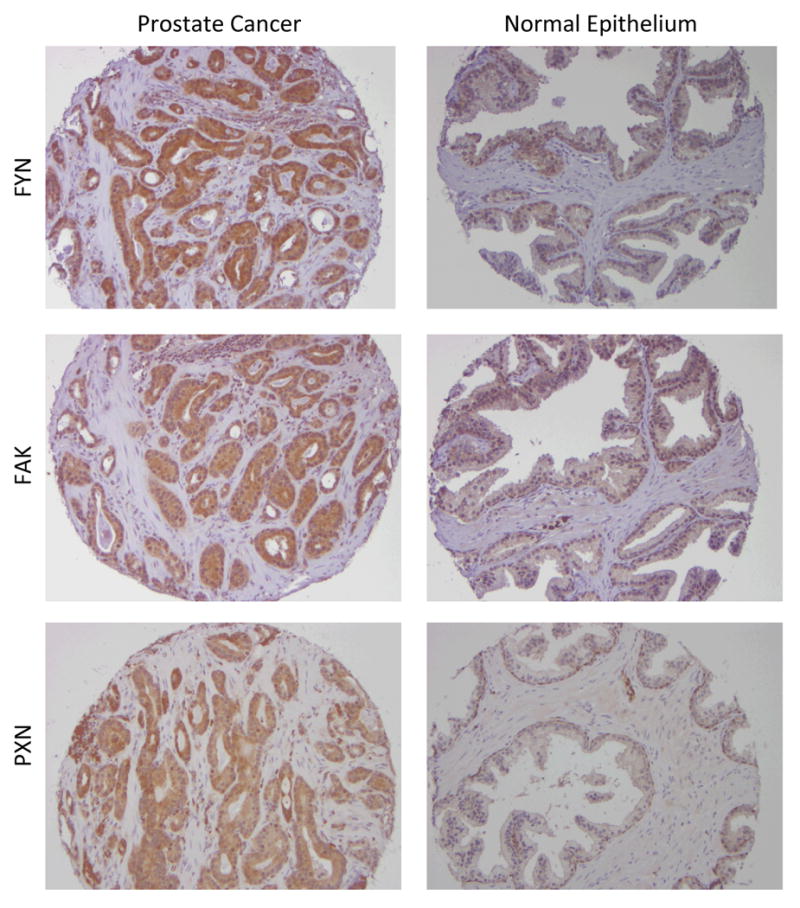
Figure 3.

Plots of A) FYN B) FAK and C) PXN staining in malignant versus non-malignant tissue samples. Composite scores (intensity of staining × percentage of glandular cells staining) are shown on the Y-axis. The median is plotted with the error bars representing the 25th and 75th percentiles.
