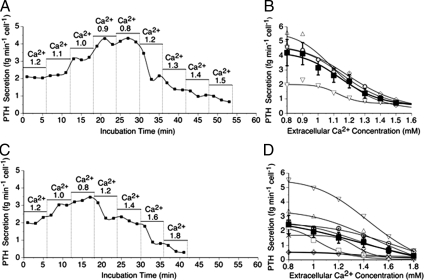
Figure 1.
Impact of Ca2+o on intact PTH secretion from normal and adenomatous parathyroid cells. Representative time-courses demonstrate the impact of progressive decreases and then increases in Ca2+o concentration (in mM) on PTH secretion from normal (A) and adenomatous (C) parathyroid cells. The Ca2+o concentration dependence of PTH secretion is shown for individual experiments for normal (B) and adenomatous (D) parathyroid cells obtained from four patients who underwent thyroid surgery and eight patients with adenomatous disease, respectively, is also shown. The filled symbols and error bars represent means ± sem for pooled data.

