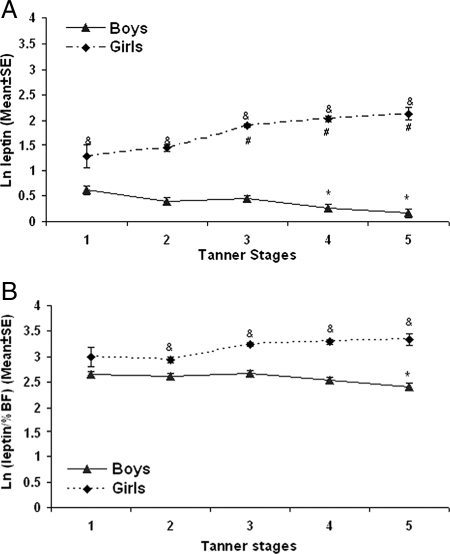
Figure 1.
A, Plasma ln (leptin levels) of the study subjects grouped by different tanner stages. *, P < 0.05 compared with boy subjects at tanner stage I; #, P < 0.05 compared with girl subjects at tanner stage I; &, P < 0.05 compared between males and females at the same tanner stage. X-axis, Tanner stages; y-axis:, ln leptin (mean ± se). B, Plasma ln (leptin levels) of the study subjects divided by %BF and grouped by different tanner stages. *, P < 0.05 compared with boy subjects at tanner stage I; &, P < 0.05 compared between boys and girls at the same tanner stage. X-axis, Tanner stages; y-axis, ln leptin (mean ± se).

