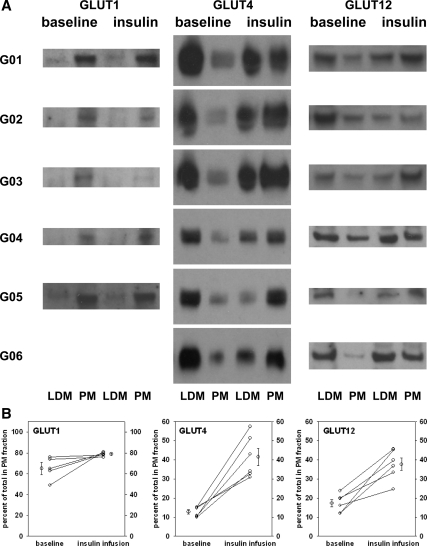
Figure 3.
Expression of GLUT1, GLUT4, and GLUT12 in normal skeletal muscle LDM and PM fractions before and after insulin infusion. Percutaneous muscle biopsies were obtained before and at the end of 3-h euglycemic insulin infusion in six normal volunteers. Muscle homogenates were divided into LDM- and PM-enriched fractions by centrifugation as described in Subjects and Methods. Representative blots are shown for each isoform in panel A. LDM and PM are designated at the bottom and “baseline” and “insulin” infusion samples are indicated at the top. The blots for GLUT1, GLUT4, and GLUT12 were each performed three times for each subject shown. The band intensities were quantified and compared with a known GLUT1, GLUT4, or GLUT12 standard using image analysis of the digitized films. The total amounts of GLUT1, GLUT4, and GLUT12 were estimated in each fraction using the quantification per gel lane (10 or 20 μg) and the total protein in the LDM and PM fractions. In the baseline samples, a mean of 13% of the GLUT4 was in the PM-enriched fractions, and insulin infusion increased the amount in the PM fractions to an average of 42%. Similarly, analysis of the GLUT12 blots revealed an average of 17% in the PM fraction at baseline and 38% in the PM fraction at the end of the insulin infusion. PM content of GLUT1 was 65 ± 6% in the baseline samples and 78 ± 2% after insulin. Each subject’s muscle biopsies were fractionated into LDM- and PM-enriched fractions by differential sedimentation. Immunoblots containing 10 μg per lane were probed with polyclonal rabbit anti-hGLUT1, anti-hGLUT4, or anti-hGLUT12 in the presence of a known standard of chimeric ovalbumin-GLUT1, ovalbumin-GLUT4, or ovalbumin-GLUT12 containing the peptide epitope that was used in generating the antibody. Each fraction sample was quantified by image analysis of digitized films in at least three separate studies. B, The data displayed represent the means of at least three separate estimates of the GLUT isoform protein content adjusted for the total amount of protein in each fraction. The difference between the baseline and the sample at the end of the insulin infusion was significant for both GLUT4 and GLUT12 at P < 0.01 by paired t test. There was a 20% average increase in GLUT1 content in PM that did not achieve statistical significance (P = 0.16).

