
Figure 5.
Role of PERK in virus-induced degradation of IFNAR1.
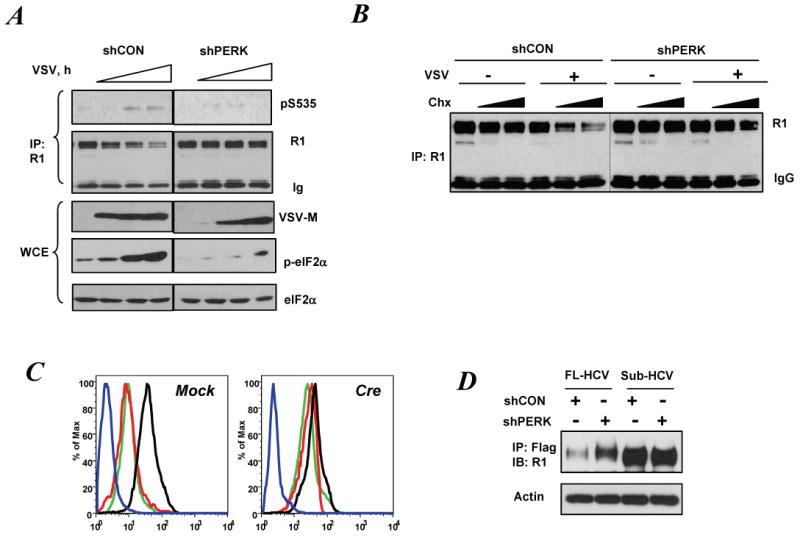
A. Phosphorylation and levels of endogenous IFNAR1 in 2fTGH cells that received indicated shRNA constructs and then were infected with VSV (for 16, 18 and 20 h) was analyzed by IP-IB using the indicated antibodies. Aliquots of IP supernatants were used for analysis of VSV-M, p-eIF2α and eIF2α levels by IB.
B. Control or PERK-depleted 2fTGH cells (as in panel A) were infected with VSV (for 17 h) and then treated with Chx (1 or 10μg/ml for 1.5 h). Total levels of IFNAR1 were determined by IP-IB.
C. Levels of cell surface IFNAR1 analyzed by FACS using monoclonal anti-mIFNAR1 antibody in MEFs from PERKfl/fl mice (transduced with either empty vector (Mock) or construct for expression of Cre) were either left untreated (black line) infected with VSV (for 17 h, red line) or treated with TG (1μM for 4h, green line). Blue line represents the isotype Ig control.
D. Levels of IFNAR1 and actin in Huh7 cells harboring the full-length or subgenomic HCV that were co-transfected with Flag-IFNAR1 and indicated shRNA constructs were analyzed using indicated antibodies.