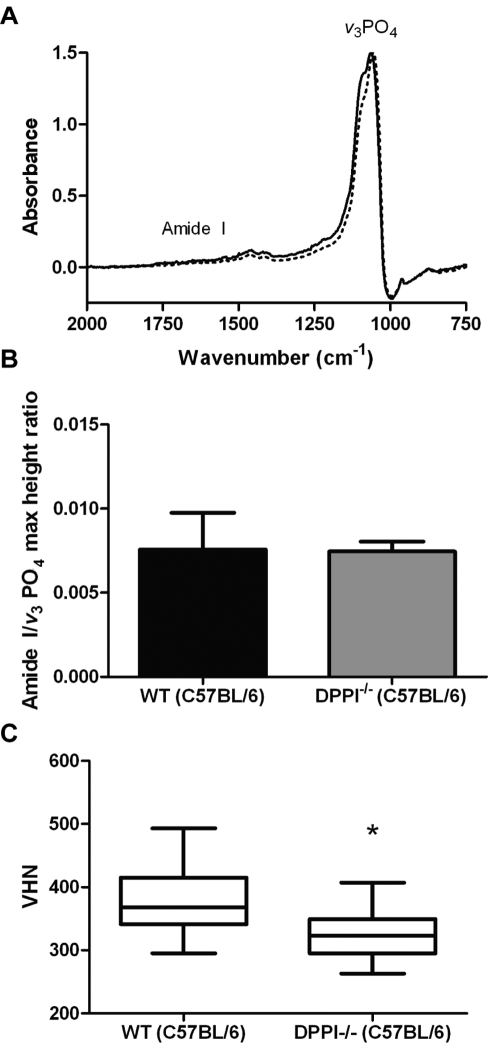
Figure 4.
Characterization of enamel from DPPI null mice. (A) Representative normalized FTIR absorption spectra of enamel from wild-type (solid line) and DPPI null C57BL/6 mice (dashed line) collected in reflectance mode. Amide I protein band and v3PO4 band are shown. (B) Amide I/v3PO4 maximum height ratio from the enamel of DPPI null mice compared with that of wild-type C57BL/6 mice (n = 3). No difference in protein-to-mineral ratio is observed in null mice. Data are presented as mean ± SEM. (C) Box chart representing Vickers microhardness data for enamel from DPPI null and control incisors with 30 indentations per incisor (n = 3). The Y-axis shows the Vickers hardness number (VHN). Whiskers represent minimum and maximum. Student’s t test showed that the means were significantly different (*p < 0.05).

