Figure 2.
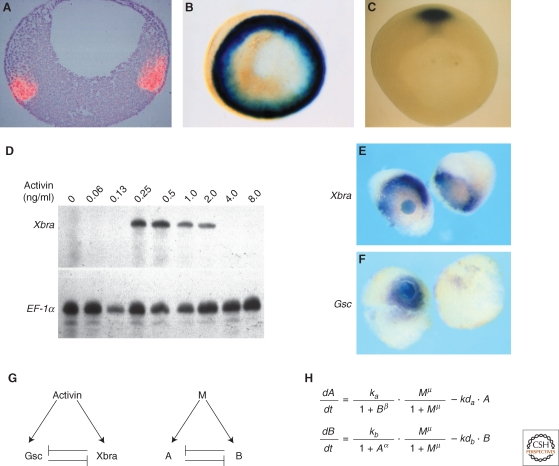
Threshold formation. (A,B) Normal expression of Xbra. (A) Sectioned in situ hybridization showing expression of Xbra in red. Animal pole is to the top and vegetal pole to the bottom. Photograph courtesy of Linda Essex and Michael Sargent. (B) Whole-mount in situ hybridization viewed from the vegetal pole. Notice expression of Xbra throughout the marginal zone. (C) Whole-mount in situ hybridization showing expression of goosecoid in the dorsal region of the embryo. Photograph by Susie Zoltewitz. (http://www.xenbase.org/xenbase/original/WWW/Marker_pages/organizer/goosecoid.html). (D) Differential expression of Xbra in response to different concentrations of activin. Disaggregated animal pole cells were exposed to the indicated concentrations of activin, reaggregated, and cultured until the equivalent of early gastrula stage 10. They were then assayed for expression of Xbra and EF-1α by RNase protection. Note that Xbra is only activated by intermediate concentrations of activin. (E) Activation of Xbra by intermediate concentrations of activin. An activin-soaked bead was placed between two animal pole regions and cultured for 5 hours before being assayed for expression of Xbra. Note that Xbra is not activated close to the bead but at a distance, where the concentration of activin is at the appropriate level (Papin and Smith 2000). (F) Activation of goosecoid by high levels of activin. An identical experiment to that illustrated in (E), but assaying for expression of goosecoid (Papin and Smith 2000). (G,H) An attempt to understand threshold formation. (G) Left-hand side illustrates that activin activates both goosecoid and Xbra, and the two gene products repress each other's expression. The same relationshiop with activin represented as M (morphogen) and goosecoid and Xbra as “A” and “B”, respectively. (H) Equations describing the rates of synthesis of A and B in response to M. M, A, and B represent the concentrations of each component, ka and kb are the synthesis rates of A and B, respectively, kda and kdb are the decay rates, α and μ are the cooperativities of repression of A by B and B by A, respectively, and μ is the cooperativity of induction by M (Saka and Smith 2007).

