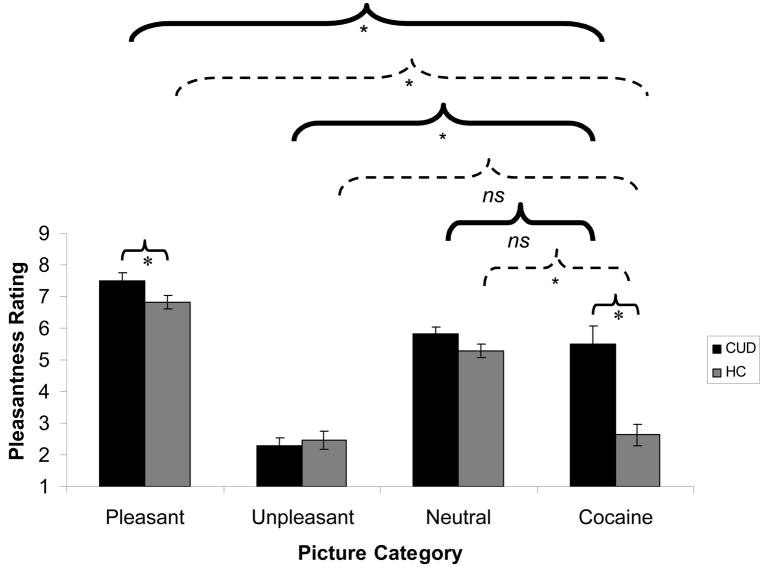
Figure 3.
Results of the picture ratings for (A) pleasantness and (B) arousal for each of the four picture types (pleasant, unpleasant, neutral, and cocaine) for individuals with cocaine use disorders (CUD; N=20), as compared to healthy comparison subjects (HC; N=19; one control subject did not complete picture ratings due to keypad malfunction). For both (A) and (B), error bars represent standard error of the mean. Between-group comparisons are indicated by light, solid lines; within-group comparisons for CUD are indicated by heavy, solid lines; and within-group comparisons for HC are indicated by broken lines; * p<0.05; all comparisons shown directly pertain to our a priori hypotheses. Supplementary Table 1 presents all significant comparisons (including comparisons not displayed in Figure 3), as well as means and standard errors for both picture ratings.


