
Figure 2.
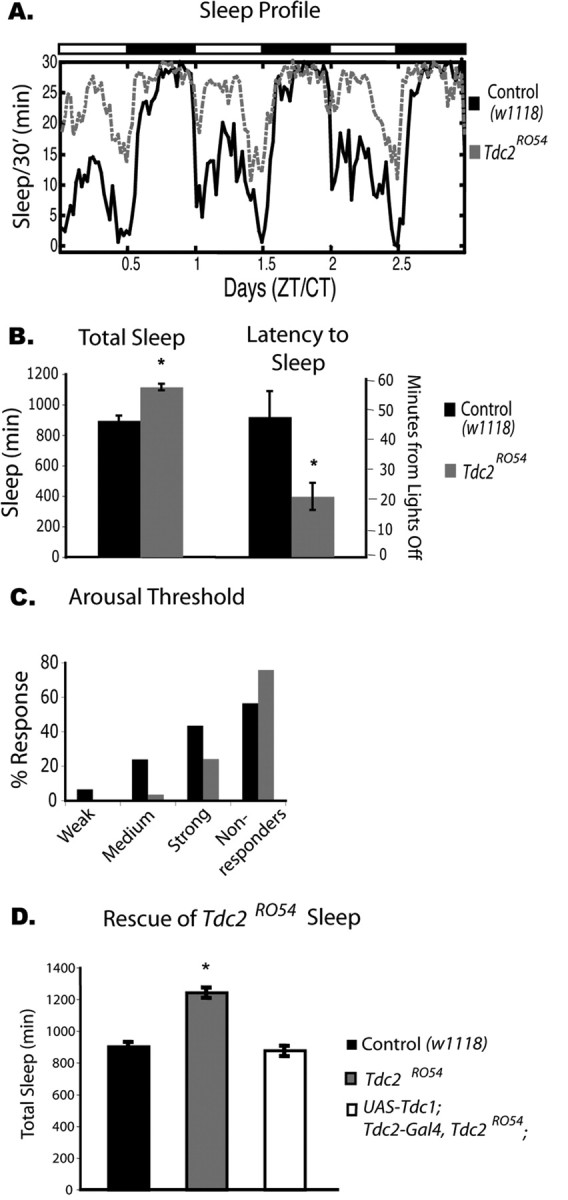
Baseline sleep phenotype of Tdc2RO54 mutants, which have decreased levels of octopamine and tyramine. A, Three days of baseline sleep recording in Tdc2 females. The Tdc2RO54 line (gray dashed line) shows significantly more sleep than its control w1118 (black solid line). Dark bars and white bars on top indicate nighttime and daytime, respectively. n = 8 for Tdc2RO54 and w1118. CT, Circadian time; ZT, Zeitgeber time. B, Total sleep is significantly increased in Tdc2RO54 mutant females (mean ± SEM; Tdc2RO54, 1115 ± 19, n = 23; w1118, 895 ± 32, n = 32; p ≤ 0.0001, two-way ANOVA). Latency to sleep is significantly lower in Tdc2RO54 mutants (mean ± SEM; Tdc2RO54, 20.6 ± 4.6, n = 23; w1118, 47.5 ± 8.7, n = 32; p ≤ 0.001, two-way ANOVA). C, Arousal threshold during sleep in the Tdc2RO54 mutants. The animals were given three levels of stimulation to determine whether they were arousable. All animals that responded to the first stimulation were also aroused on stronger stimulation. Compared with wild type, the Tdc2 mutant line had a higher percentage of flies that did not respond to any of the three levels of stimulation. In addition, fewer Tdc2RO54 flies responded to the weaker stimuli (Tdc2RO54, n = 23; w1118, n = 32). D, Rescue of the baseline sleep phenotype in Tdc2RO54 with expression of the Tdc1 gene. Total sleep was quantified, and Tdc2RO54 mutant females were significantly different from both wild-type and rescued animals. There was no significant difference between rescued animals and controls (mean ± SEM; w1118, 895 ± 33, n = 32; Tdc2RO54, 1238 ± 33, n = 16; p ≤ 0.0001; UAS–Tdc1; Tdc2–Gal4, Tdc2RO54, 871 ± 33; n = 16).