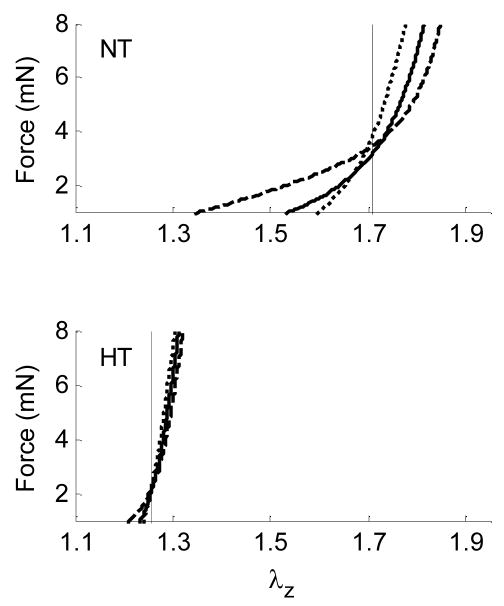
Figure 4.
Averaged axial force-stretch data at fixed pressures of 60 (----), 100 (——), and 140 ( ) mmHg for carotid arteries of wild type mice (FBN1+/+) that were nearly normotensive NT or hypertensive HT (i.e., experienced an ~30% increase in pulse pressure for 5 to 8 weeks). Note that cross-over points/intersections estimate the in vivo axial stretch (vertical lines). Data replotted from Eberth et al. (2008b).

