
Figure 5.
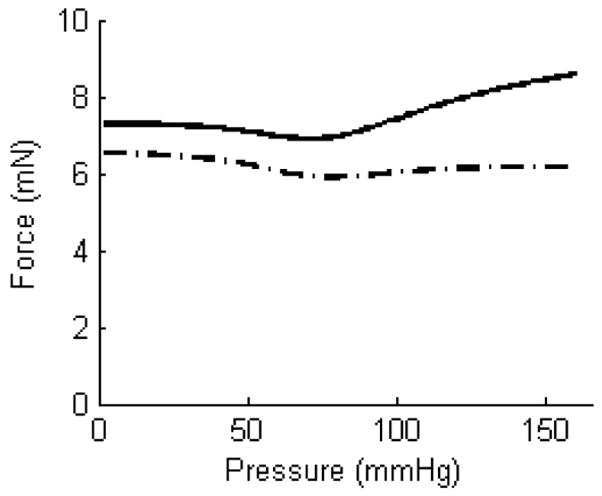
Axial force-pressure data collected during cyclic pressurization tests performed on the same artery at the same axial extension before (——) and after two days of culture ( ). In particular, the solid curve shows data before culture at an axial extension of 1.95, which was well above the in vivo value of 1.87 (FVB/N mice); the dot-dashed curve shows data at the same extension following two days of culture at that extension. As it can be seen, the vessel tended to exhibit a near constant force after two days suggesting it had adapted to its elevated stretch.