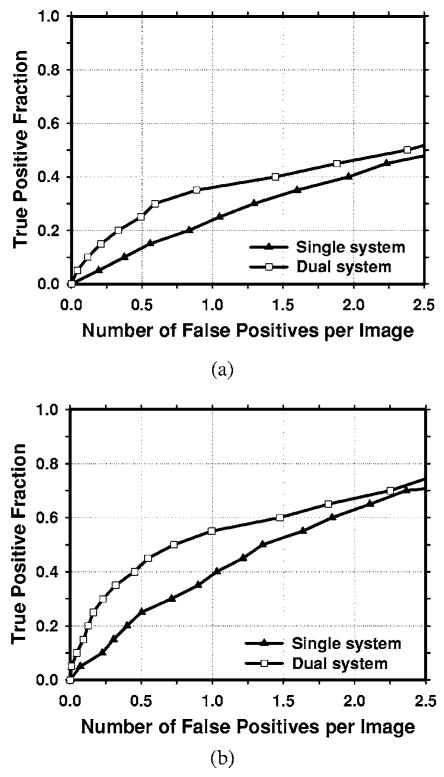
Fig. 10.
Comparison of the average test FROC curves for the single CAD system and the dual CAD system for detection of the subtle masses on the prior mammograms. The single CAD system trained with average masses alone was used and the FP rate was estimated from the mammograms without masses. (a) Image-based FROC curves, (b) case-based FROC curves.

