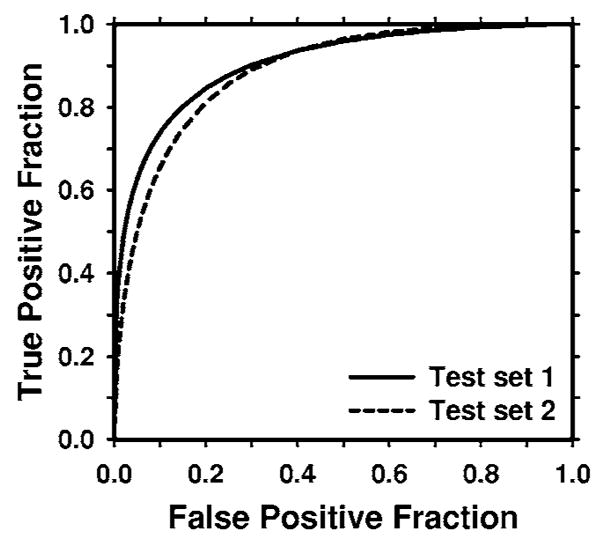
Fig. 6.

The test ROC curves for the BP-ANN classifiers from the two independent mass subsets. The ANN classifiers achieved an Az value of 0.90±0.02 for test subset 1 and 0.89±0.01 for test subset 2 in the classification of mass and normal breast tissues.
