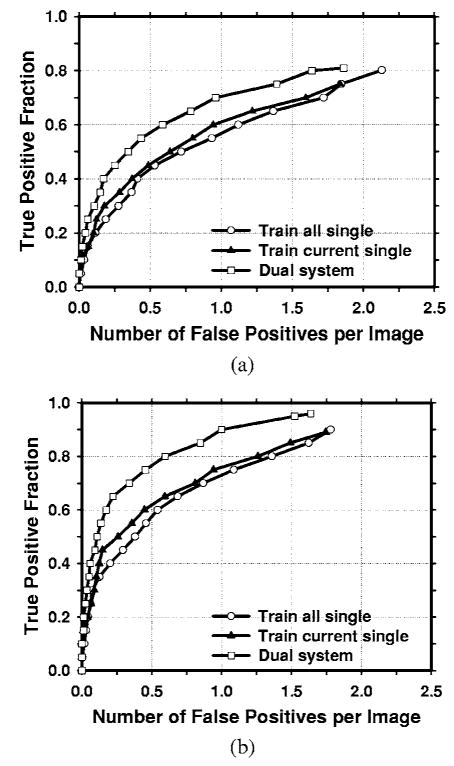
Fig. 7.
Comparison of the average test FROC curves obtained from averaging the FROC curves of the two independent average-mass subsets. Three CAD systems were compared: a single CAD system trained with average masses alone, a single CAD system trained with both the average and the subtle masses, and the dual CAD system. The FP rate was estimated from the mammograms with masses. (a) Image-based FROC curves, (b) case-based FROC curves.

