Abstract
An automated method is being developed in order to identify corresponding nodules in serial thoracic CT scans for interval change analysis. The method uses the rib centerlines as the reference for initial nodule registration. A spatially adaptive rib segmentation method first locates the regions where the ribs join the spine, which define the starting locations for rib tracking. Each rib is tracked and locally segmented by expectation-maximization. The ribs are automatically labeled, and the centerlines are estimated using skeletonization. For a given nodule in the source scan, the closest three ribs are identified. A three-dimensional (3D) rigid affine transformation guided by simplex optimization aligns the centerlines of each of the three rib pairs in the source and target CT volumes. Automatically defined control points along the centerlines of the three ribs in the source scan and the registered ribs in the target scan are used to guide an initial registration using a second 3D rigid affine transformation. A search volume of interest (VOI) is then located in the target scan. Nodule candidate locations within the search VOI are identified as regions with high Hessian responses. The initial registration is refined by searching for the maximum cross-correlation between the nodule template from the source scan and the candidate locations. The method was evaluated on 48 CT scans from 20 patients. Experienced radiologists identified 101 pairs of corresponding nodules. Three metrics were used for performance evaluation. The first metric was the Euclidean distance between the nodule centers identified by the radiologist and the computer registration, the second metric was a volume overlap measure between the nodule VOIs identified by the radiologist and the computer registration, and the third metric was the hit rate, which measures the fraction of nodules whose centroid computed by the computer registration in the target scan falls within the VOI identified by the radiologist. The average Euclidean distance error was 2.7±3.3 mm. Only two pairs had an error larger than 10 mm. The average volume overlap measure was 0.71±0.24. Eighty-three of the 101 pairs had ratios larger than 0.5, and only two pairs had no overlap. The final hit rate was 93/101.
Keywords: computer-aided diagnosis, lung nodules, segmentation, registration, cross-correlation
I. INTRODUCTION
Lung cancer is the leading cause of cancer death in the United States, accounting for 31% (male) and 26% (female) of all cancer death.1 The overall 5-year survival rate is only 15%, but studies show that the survival chance of lung cancer patients can be improved by early diagnosis and treatment.2 Periodic low-dose computed tomography (CT) examinations of the lung are recommended by several studies.3,4 Multi-detector CT scanners can typically produce high resolution. Both slice thickness and in-plane pixel size can be submillimeter. High-resolution CT scans make it feasible to analyze small nodules for early diagnosis and treatment, but detecting and registering nodules between serial CT volumes with a large number of slices is time consuming. Moreover, small nodules are prone to be missed.5,6 Computer-aided diagnosis systems have been designed to help radiologists improve their efficiency and accuracy in lung nodule detection and classification.7–10 In this study, we focus on automating the registration of pulmonary nodules in serial CT scans, which is an important step for computer-assisted analysis of nodule interval change and characterization.11
Image registration is a common procedure in medical image analysis.9 Conventional registration methods such as affine transformations,12 nonlinear warping,13 and mutual information14,15 have been used widely for various medical applications. Our study aims at predicting the position of lung nodules in a target thoracic CT scan based on its location in a source thoracic CT scan for the purpose of interval change analysis. Because of the possible variations in patient positioning, variations in the lung volume and shape at different stages of a respiratory cycle, and changes in the nodule size and shape in the serial scans, nodule registration can be a challenging task.
Several research groups have previously investigated lung nodule registration. Betke et al.16 developed an automated method for registering whole thoracic CT scans, using the rigid affine transformation and the iterative closest-point (ICP) algorithm.17 Lung nodule registration is then conducted among all possible nodule pairs from the source and target CT scans. Pairs that have the smallest Euclidean distance are defined as the corresponding nodules. They evaluated the method on ten patients. The average Euclidean distance error over 58 pairs of nodules was 8 mm and the correspondences of 56 nodule pairs were established correctly. Their study also suggested that the ribs could be good anatomical structures for registration because they generally move together with the lung during respiration and landmarks on the ribs are reliable. Hong et al.18,19 proposed a multi-step method for nodule registration, including segmentation of the lung, estimation of initial translation, refinement of initial alignment by an iterative surface registration, and construction of nodule correspondences by using the smallest Euclidean distances. The average Euclidean distance error for 20 patients was 4.7 mm. Blaffert and Wiemker20 compared five registration methods using 20 pairs of temporal CT scans. The average Euclidean distance errors of the methods ranged from 4.2 to 5.3 mm. Sun et al.21 proposed to use six pairs of segmented structures in the vicinity of a nodule for registration. The registration was guided by maximizing the cross-correlation coefficient and the variance of the affine transformation parameters. The results of their study were promising; however, correct selection and segmentation of the six structure pairs may present difficulties in practice. In a recent study,22 Reeves et al. used a 3D rigid affine transformation for registration of small volumes of interest containing nodules whose localization and size were predetermined using a 3D template matching method. Since their emphasis was nodule growth rather than registration, quantitative results on registration accuracy were not described.
Although research on nodule registration has been progressing, better registration performance is still required before it can be introduced to clinical practice for assisting radiologists in temporal change analysis. We have developed a new prototype system for automated nodule registration based on the rib anatomy and template matching in serial CT examinations. Our method uses the rib centerlines as the reference for initial nodule registration, which is then refined by nodule template matching. Three metrics were used for performance evaluation. The first metric was the Euclidean distance between the nodule centers identified by the radiologist and the computer, the second metric was a volume overlap measure, and the third metric was the fraction of nodules whose centroid computed by the computer registration in the target scan falls within the VOI identified by the radiologist.
II. METHODS
Figure 1 shows the flowchart for our method. It involves three major steps: (1) automated segmentation and labeling of the rib anatomy, (2) local registration of nodules using a 3D rigid affine transformation, and (3) refinement of registration using template matching supplemented by a geometrical constraint. Before the three major steps, the source and target thoracic CT scans are linearly interpolated in the axial (z) direction to have the same slice thickness of 1.25 mm for efficient implementation.
Fig. 1.
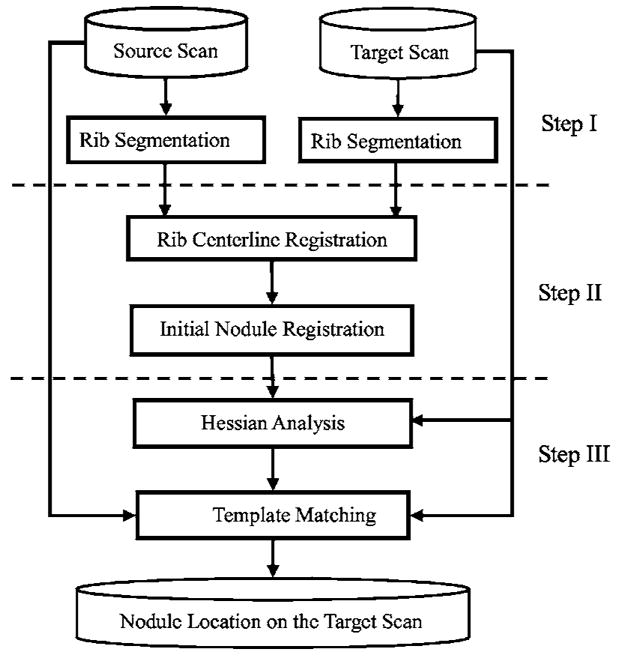
Flowchart for our pulmonary nodule registration method in two serial CT scans.
A. Rib segmentation
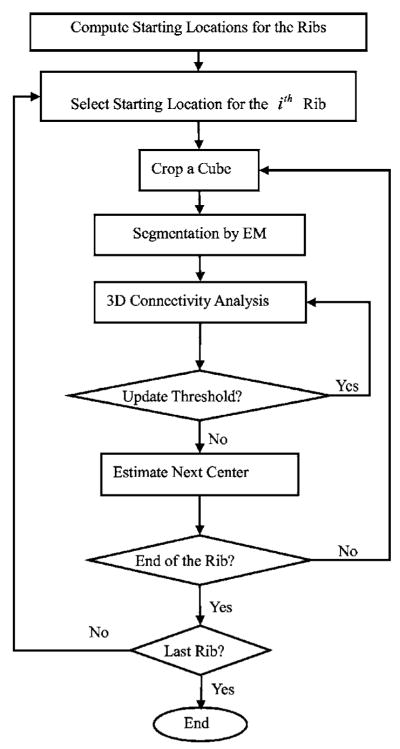
Several research groups have investigated rib segmentation in the past few years.23–25 We have developed a computationally efficient, spatially adaptive, recursive, and automated rib segmentation method for the purpose of pulmonary nodule registration in 3D CT scans. Our method first locates the positions where the ribs join the spine. These positions define the starting locations. From each starting location, the rib is tracked using a moving cube. The expectation-maximization (EM) algorithm is used to segment ribs within each cube location. Figure 2 shows the flowchart for our rib segmentation.
Fig. 2.
Flowchart of the rib segmentation method.
1. Component separation by the EM algorithm
EM is a popular method for estimating parameters in probabilistic models. It is applicable to the same type of problems as the maximum likelihood method, but it can also solve problems that have either missing or incomplete data (hidden data). In our application, the CT volume is the observed data Y. We assume that Y contains a mixture of three components: background, soft tissue, and bone. The component that each voxel in Y belongs to is the hidden data. The EM algorithm is designed to separate the gray level histogram of Y into three Gaussian distributions. The gray level of each component i typically has a Gaussian distribution with mean μi and standard deviation σi:
| (1) |
for background, software tissue, and bone, respectively. Let wi be a mixing coefficient weighting the contribution of the ith component to voxels in Y. Our model then has nine parameters θ={(w1, μ1, σ1), (w2, μ2, σ2), (w3, μ3, σ3)}. The mixing probability for a gray level t is
| (2) |
subject to and μ1 ≤ μ2 ≤ μ3.
Let K be the total number of voxels in Y and tk be gray level of the kth voxel. We estimate the parameter values by maximizing the log-likelihood of the mixing probability:
| (3) |
Starting with the initial set of parameter values θ0, the EM algorithm solves Eq. (3) by iteratively computing the expectation of the ith component for the kth voxel,
| (4) |
and then updating θ in terms of the estimated expectation of the hidden data. The iteration is terminated as long as it reaches either the fitting convergence or a preset maximum number of iterations.26,27
2. Starting locations for the ribs
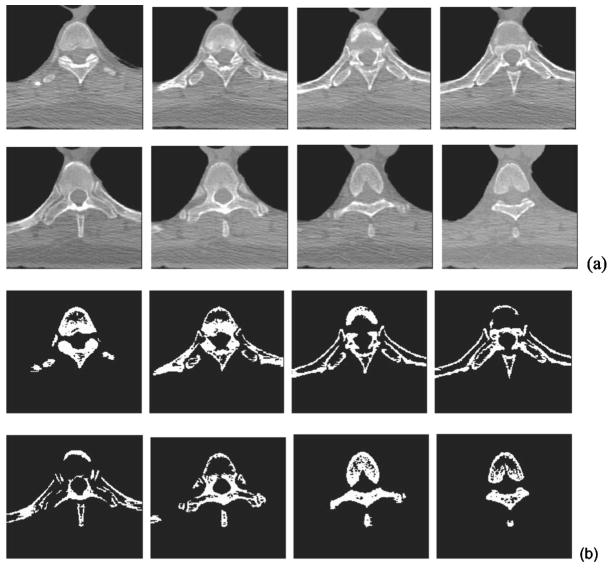
Our rib segmentation method locates the region where the ribs join the spine and defines a starting location in this region for rib tracking. To achieve this, a region of interest (ROI) containing the spine and parts of the ribs is first automatically determined on each slice. The thorax region and the left and right lungs are segmented by k-means clustering.7 Using the location of the lungs and the fact that the spine is in the central part of a 2D slice, we adaptively define a ROI on each axial slice relative to the geometrical centers of the left and right lungs and the extent of the patient’s body near the lower portion of the 2D slice. Figure 3(a) shows a series of such ROIs that contain part of the vertebra and the fifth rib pair. The bones in each ROI are then segmented using the EM algorithm. Figure 3(b) illustrates the bone segmentation results for the ROIs shown in Fig. 3(a). We then determine the maximum extent of the segmented bone objects in the x direction (horizontal direction) on each slice, referred to as bone span below, as follows: Each ROI is scanned line by line from top to bottom. If a line intersects the segmented bone objects, the leftmost and rightmost intersections are selected, the distance between which is defined as the line extent. The bone span is obtained as the maximum of all line extents in the ROI. The bone span information is used to determine where each rib joins the spine, by plotting the profile of the bone span with respect to the CT slice number (i.e., z coordinate) from the neck to the abdomen, and finding the peaks in this profile. The coordinate zi for the two starting locations of the ith pair of the left and right ribs are selected based on the local maxima of the smoothed profile. Figure 4 shows an example of such profile, in which the arrow indicates the approximate coordinate z5 where the fifth rib pair joins the fifth thoracic vertebra. The rib interval, defined as the spacing between two adjacent ribs, used in rib tracking is also estimated from this profile. In the ROI of the zith axial CT slice, we select two outermost points: (xiL, yiL, zi) for the left rib and (xiR, yiR, zi) for the right rib as the starting locations.
Fig. 3.
Bone segmentation for starting points of the rib tracking. (a) A series of small regions containing the spine and portions of the fifth rib pair. The slices are ordered from left to right and top to bottom. (b) Segmentation results of the series of small regions in (a). They were used to determine the starting locations of the fifth rib pair.
Fig. 4.
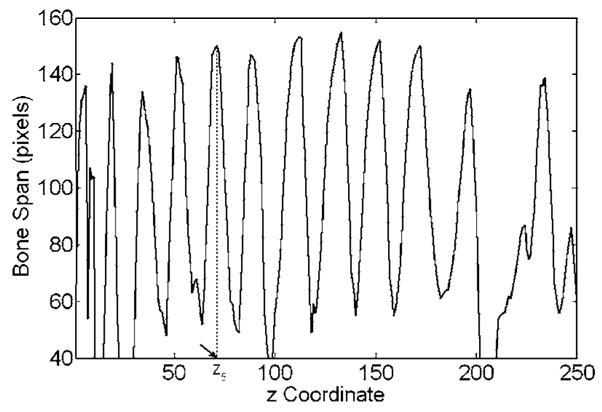
Profile for the rib starting locations along the spine. The z coordinate stands for the CT slice number in the ascending order from the neck to the abdomen. The coordinate z5, where the fifth rib pair joins the fifth thoracic vertebra, is indicated by the arrow.
3. Rib segmentation, tracking, labeling, and skeletonization
Our method recursively tracks each rib from its starting location. A series of small overlapping cubes along a rib is sequentially constructed. The bones in each cube are segmented using the EM algorithm and 3D connected component analysis. Once the rib in the current cube is segmented, the position of the next cube is determined by the center of the previous cube and the geometrical center of the intersection between the current cube surface and the rib in the direction that the rib has not been tracked. The step size of the moving cube is therefore about half of the cube size. The partial overlap of two consecutive cubes results in a smooth transition between neighboring rib pieces.
The ribs need to be labeled on each scan for our application. Typically, the axial slices containing the apex of the lungs also contain the second pair of ribs as illustrated in Fig. 5. We therefore first identify the second rib pair by considering the position of the segmented lung apex and the spine profile in Fig. 4. The other ribs are then labeled sequentially according to the profile. In the rib labeling process, the rib interval is used to identify possible missing ribs.
Fig. 5.
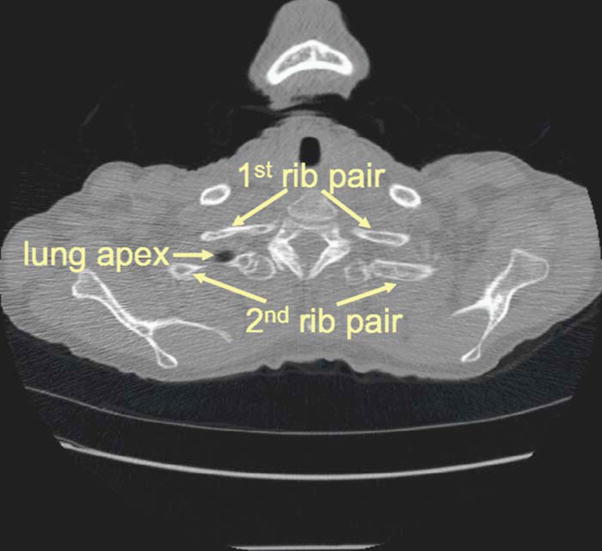
The slice where the lung apex starts to appear. This slice was used as the reference for labeling the second rib pair.
In order to reduce computational cost in evaluating the objective function and improve the robustness of the optimization of the parameter values of the rigid affine transformation, only the centerlines of the ribs are used in the following steps. The centerlines can be obtained using skeletonization, for which conventional methods have been discussed in the literature.28 Figure 6 shows an example that contains 11 pairs of rib centerlines. The first rib pair is above the apex of the lungs and not included.
Fig. 6.
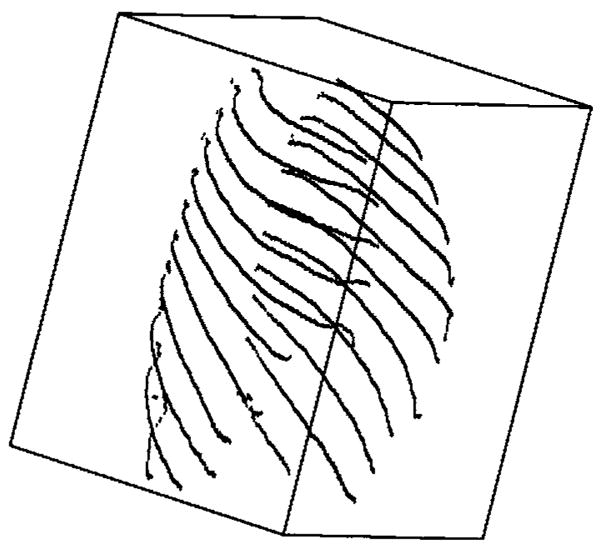
Rib centerlines after segmentation, labeling, and skeletonization. The first rib pair is not involved in nodule registration and is not segmented.
B. Initial nodule registration using rib centerlines
In the second major step of the method, we use 3D rigid affine transformation to obtain an initially registered volume in the target scan that corresponds to a nodule in the source scan. For a nodule in the source scan, we locate the three ribs that are closest to the nodule. We then perform the initial registration in two stages. Given a pair of corresponding rib centerlines in the source scan and the target scan without labeling any corresponding anatomical landmarks, the first stage uses simplex optimization to search for the best parameter values for a rigid affine transformation between the two ribs. The initial translation for the optimization is determined using the bounding boxes of the ribs in the source and target scans, and the initial rotation is defined as zero. In the second stage, we automatically define a number of control points on the three registered ribs, which are then used to determine a closed-form solution for a single 3D rigid affine transformation that relates the two volumes.
1. Rib registration using rigid affine transformation and simplex optimization
Our method uses the rigid affine transformation twice, first for rib centerline registration and second for initial nodule prediction. Since the ribs are physically rigid, our method uses the 3D rigid affine transformation with six independent parameters (three for rotation and three for translation) for both the first and second stages. As discussed above, each thoracic CT scan is interpolated in the z direction to have the same slice thickness. In addition, a scaling factor is derived from the in-plane pixel sizes of the source and target CT scans to account for any possible differences in the field-of-view between the two scans. We therefore did not need to include scaling parameters in our 3D affine transformation.
Due to breathing, the ribs may move independently. We use a different pair of rotation matrix and translation vector for each rib. Let and be a pair of corresponding centerlines on the source and target CT scans, respectively. The two centerlines may have different numbers of points. Let R and T denote the joint rotation matrix and the translation vector, respectively. Applying the rigid affine transformation to Cs yields the registered center-line Cr in the target CT volume:
| (5) |
where R and T are estimated using simplex optimization.
We define the objective function for measuring how well two centerlines are aligned as follows:
| (6) |
where || · ||1 denotes the l1 norm (also called the city-block distance). l1 norm is used here for computational efficiency. Essentially, J1 measures the resemblance of two sets of geometric points and is symmetric with respect to Cr and Ct. Our goal is to find the optimal rotation matrix and the translation vector, which minimize J1 for each rib pair. Since a closed-form solution is not possible, the simplex method29 is used to find the optimal parameters.
One problem with the simplex optimization is that it may be trapped in local minima. We address this issue by assigning an appropriate initial rotation matrix and translation vector. We initialize rotation and translation using the bounding boxes of the ribs. In practice, two chest CT scans typically are generated under a certain protocol and the patient chest skewness is small so that the two CT scans are misaligned mostly due to translation. The translation may result from either different torso positions or different points in the respiratory cycle. Based on the rib cage, our method can roughly estimate the translation. First, in the source CT scan, three ribs that are closest to the centroid of the given source nodule are identified. A bounding box is constructed by using the centerlines of these three pairs of ribs. The rib labels of these ribs in the source CT scan are then used to select the corresponding ribs in the target scan and the target bounding box is constructed for their centerlines. The initial translation for the simplex method is the shift between the geometrical centers of the two bounding boxes. Good initial translation and rotation can reduce optimization time and the risk of being trapped in local minima.
2. Nodule registration by control points
For each of the three ribs closest to the nodule, the method in the first stage described above may provide different affine registration parameters. Our goal in this stage is to determine a single affine registration for the nodule that may be a compromise of the three rib registrations found in the first stage. For this purpose, our method automatically selects control points along the three pairs of registered centerlines. Given a point on the rib centerline in the source scan, we first find the registered point using the affine transformation for the pair. We then find the l1 norm between and the points (1 ≤ j ≤ m) in the target centerline Ct. If the following condition is satisfied,
| (7) |
where ε is the error tolerance, then we define the pair of control points from the source to the target as:
| (8) |
Let { } and { }, where n′ ≤ n, be all the corresponding control points on the source and target, respectively. To find the second-stage rotation matrix Rs and translation vector Ts, we first define the objective function J2(R,T) as the sum-of-squares distance between the control points in the target scan and the registered control points from the source scan:
| (9) |
where || · ||2 denotes the l2 norm (i.e., the Euclidean distance). The l2 norm is used at this step because it allows the optimal registration parameters Rs and Ts that minimize J2 to be computed using a closed-form formula.30 The process is computationally efficient.
Because the 3D rigid affine transformation does not utilize any gray-level information and lungs are nonrigid (lung volume and shape may change during respiration and nodules may grow), the nodule positions may not register very accurately at this step. However, the initial predicted nodule position can still give us a good starting point for nodule template matching, which refines the nodule registration by exploiting the gray-level information.
C. Template matching
Template matching is designed to search for correct pulmonary nodules in the target scan by using the nodule templates from the source scan. Exhaustive searching is inefficient and prone to mismatching. We propose an efficient method to reduce the search space by using the Hessian response. We also supplement template matching by a geometrical constraint.
1. Hessian response
The Hessian response has many applications in computer-aided diagnosis and detection, for example, microcalcification analysis in mammograms31 and nodule detection and false positive reduction in thoracic CT scans.5,32 In thoracic CT scans, the Hessian response can differentiate nodules from vessels, which can typically be represented as spherical objects and tubular objects, respectively. In this study, we employ the Hessian response to reduce the search space for nodule template matching.
The Hessian response essentially is based on the tensor analysis of a data volume in terms of the second-order derivatives. The eigenvalues of the Hessian matrix contain important information about the shape of the object around the voxel (x,y,z).33 For better utilization of the Hessian eigenvalues, and to reduce noise in the second-order derivatives, a common technique is to compute the Hessian matrices at multiple scales. At each scale, the image volume is convolved with an isotropic Gaussian function with a different standard deviation. The eigenvalues at different scales are then combined using a response function to distinguish spherical structures from tubular structures. In our previous study,34 we demonstrated that a neural network classifier can be trained to merge eigenvalues at three different scales. The output of the classifier can then be used to distinguish voxels belonging to spherical or tubular structures in CT scans.
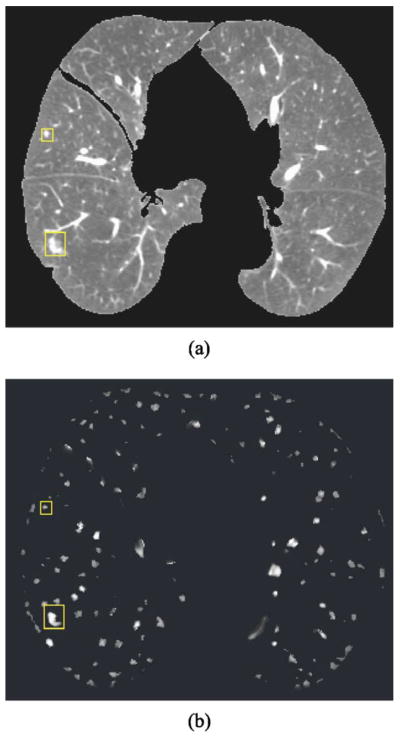
Figure 7 shows one CT slice and the Hessian response obtained using the neural network classifier that we trained previously with a data set independent of the one used in the current study. Two nodules identified by the rectangles are enhanced while most tubular vessels are suppressed. To reduce the search space for template matching, our method sets a threshold Th for the Hessian response such that nodule template matching is performed only at voxels whose Hessian response is greater than Th. The value of Th is experimentally determined.
Fig. 7.
(a) A slice of the 3D lung volume. Two nodules are identified by the boxes. (b) The 3D Hessian responses on the same slice as in (a). The nodules are discernible in (b), whereas many of the vessels have been suppressed.
2. Template matching using cross correlation
Cross correlation is a popular method to measure the similarity of two data sets. It is used frequently in image registration.35–37 We use it to match a nodule template to nodule candidates. The nodule template is defined as the volume of interest (VOI) marked by an experienced radiologist in the source CT volume as containing the nodule, centered around the point . Let denote the corresponding initial nodule center coordinates in the target CT scan, obtained using the registration technique described in Sec. IIB2. We define a small search VOI Ω (5×5×5 cm3 in this study) centered at ot in the target CT scan. Each voxel within Ω that has Hessian response greater than Th is considered a candidate nodule center. The nodule center predicted in the target scan by template matching is defined as , where the cross-correlation coefficient between the nodule template and the corresponding nodule candidate is the maximum among all candidates.
3. Geometrical constraint
Although template matching may, in general, increase the precision of the predicted nodule center location, we found that it can be detrimental, especially for small juxta-pleural or peripheral nodules, for which the template may not be very distinct. We introduce a geometrical constraint to require that the distance between the nodule center and the lung surface in the source scan cannot be very different from that in the target scan. Let ds and dt, respectively, denote the distance of the source nodule center to the source lung surface and the distance of the predicted center to the target lung surface. The geometrical constraint requires that the ratio, ds/dt ≤ Td and dt/ds ≤ Td. The refined nodule center location in the target CT scan is defined as
| (10) |
In our study, we experimentally chose Td=3 to correct registration errors for small juxta-pleural and peripheral nodules. The location of a nodule was determined automatically using the segmented lung information.
D. Data set
The system performance was evaluated on a clinical data set of 48 CT scans from 20 patients collected from patient files with Institutional Review Board approval. Each patient had two or three scans with a time interval greater than 2 months. Experienced chest radiologists identified 101 pairs of nodules with diameters ranging from 2.5 to 50.3 mm. The number of nodules per scan ranged between 1 and 6. Figure 8 shows the change of pulmonary nodule size on the source (prior) and target (current) scans, as measured by an experienced chest radiologist. Because the exact size is difficult to measure for small lesions, 20 nodules with a diameter less than 3 mm are plotted at a diameter of 2 mm. The number of juxta-pleural, internal, and juxta-vascular nodules were 15, 45, and 5, respectively. Nodules that were identified only on one scan of a patient were excluded from the study. Each nodule was marked by a 3D box containing only the nodule and its closely surrounding tissue, which was considered its ground truth VOI. Figure 7(a) shows two such regions in one CT slice. All CT images had 512×512 pixels. The reconstruction interval ranged from 0.625 to 7 mm, and the in-plane pixel size from 0.556 to 0.82 mm. We used linear interpolation to resample the CT scans in the z direction to obtain a uniform slice spacing of 1.25 mm. The purpose of image interpolation was to facilitate the implementation of segmentation and registration.
Fig. 8.
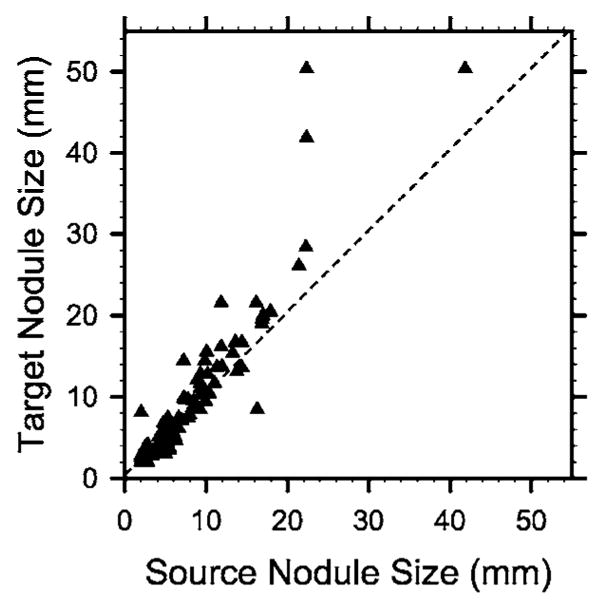
The size of pulmonary nodules, as measured by an experienced chest radiologist, on the source (prior) and target (current) scans. Because the exact size is difficult to measure for small lesions, nodules with a diameter less than 3 mm are plotted at a diameter of 2 mm.
E. Performance measures
We used three performance measures for nodule registration. They complement each other for evaluating overall performance. The first measure was the Euclidean distance error between the geometrical centers of the estimated nodule VOI and its ground truth. This is a good measure commonly used for registration performance, but it does not account for nodule size. For small nodules, the nodule may still be erroneously registered to an adjacent structure in the target CT scan even if the Euclidean distance is small, but nonzero. It will be useful to determine if the VOI in the target scan determined by computer registration actually has a large overlap with the ground truth VOI. We therefore used the volume overlap ratio, as defined below, as a second measure for assessing registration accuracy.
Let VOIT and VOIG denote the volumes of interest in the target scan determined by computer registration and by the radiologist, respectively. Since this registration study does not involve segmentation of the nodule size or shape, the predicted nodule VOIT in the target scan is defined as a region centered at with the same volume and aspect ratio as the original nodule template, as identified by the radiologist in the source CT scan. Several definitions have been used and discussed in the literature for measuring how well two objects overlap.10 We choose the volume overlap ratio as
| (11) |
which represents the fraction of the radiologist’s VOI that is included in the computer’s VOI. The minimum value of γ is zero, when VOIT does not overlap with VOIG. The maximum value of γ is 1, when VOIT completely coincides with VOIG.
The third performance measure is the fraction of nodules whose centroid computed by the computer registration in the target scan falls within the VOIG identified by the radiologist. This metric is referred to as the “hit rate.”
III. RESULTS
Table I summarizes the quantitative registration performance under different techniques.
Table I.
Registration performance under different criteria for different techniques.
| Second stage | Hessian constraint | Geometric constraint | l2 Distance error (mm) | Correlation coefficient | Volume overlap ratio | Hit rate | |
|---|---|---|---|---|---|---|---|
| Technique 1 | No | No | No | 9.7±5.5 | 0.14±0.26 | 0.24±0.27 | 28/101 |
| Technique 2 | Yes | No | No | 3.5±6.3 | 0.81±0.18 | 0.72±0.24 | 93/101 |
| Technique 3 | Yes | No | Yes | 2.9±4.6 | 0.80±0.19 | 0.72±0.23 | 93/101 |
| Technique 4 | Yes | Yes | No | 3.1±4.9 | 0.79±0.19 | 0.71±0.24 | 93/101 |
| Technique 5 | Yes | Yes | Yes | 2.7±3.3 | 0.79±0.20 | 0.72±0.24 | 93/101 |
A. The Euclidean distance error
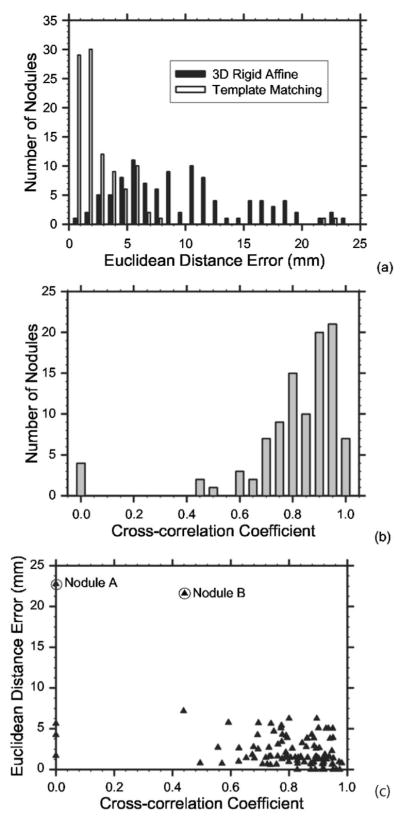
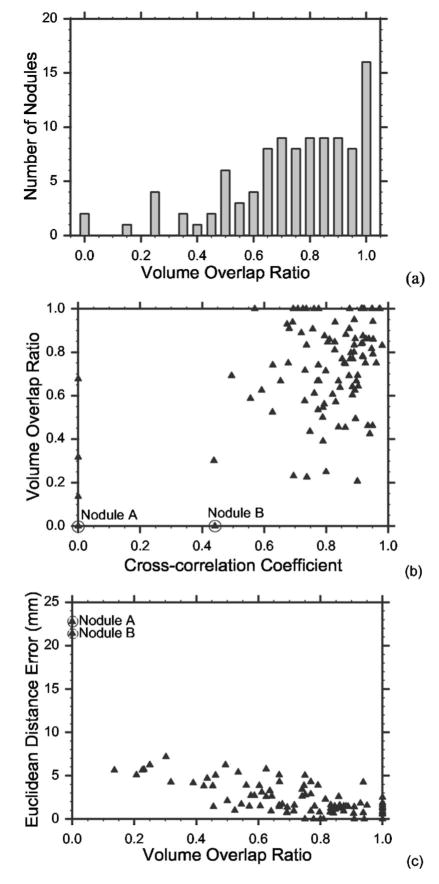
Figure 9(a) shows the distribution of the Euclidean distance errors for all 101 pairs of nodules obtained from the initial registration by the 3D rigid affine transformation. The initial registration had a mean Euclidean distance error of 9.7±5.5 mm. All actual target nodules were included in the 5×5×5 cm3 box centered at the initial registration point. Of the 101 nodule pairs, 45 pairs had registration errors over 10 mm and the volume overlap ratio averaged over all nodule pairs was very low at 0.24±0.27 (Table I), indicating that the rigid 3D affine registration for lung nodules only yields a rough estimation. Figure 9(a) also shows the distribution of the Euclidean distance errors after the final registration. Template matching and the constraints reduced the registration error to 2.7±3.3 mm. Fifty-nine nodule pairs had a Euclidean distance error less than 2 mm and only two pairs had an error greater than 10 mm. If we analyze the subgroup performances based on the nodule location, the final registration errors of juxta-pleural, internal, and juxta-vascular nodules were 2.7±4.1, 2.5±3.0, and 3.4±2.4 mm, respectively.
Fig. 9.
(a) Histogram of the Euclidean distance errors after the 3D rigid affine transformation, and the final error after refinement by template matching with the geometrical constraint. (b) Distribution of the cross-correlation coefficient ρ* between the nodule templates in the source scan and the registered location in the target scan. To show the positive cross-correlation coefficients in detail, all negative cross-correlation coefficients were grouped to the bar representing ρ*=0. (c) Scatter-plot of the Euclidean distance errors and the cross-correlation coefficients. Nodule A is misregistered due to the 3D rigid affine transformation and template matching and nodule B is misregistered due to template matching.
Figure 9(b) shows the distribution of the maximum cross-correlation coefficients (ρ*) for all 101 nodules. Ninety-four nodules had ρ* > 0.5 and four nodules had ρ* ≤ 0. To show the positive cross-correlation coefficients in detail, the negative cross-correlation coefficients were grouped to the bar representing ρ*=0. All four nodules with a negative cross-correlation coefficient had a diameter <3 mm and were attached to the chest wall. Because of the geometrical constraint, the refined predicted centers for these four nodules were the same as their 3D affine registered centers. Registering pulmonary nodules that are small and close to the chest wall is difficult as also discussed by Sun et al.21
Figure 9(c) illustrates the scatter-plot of the maximum cross-correlation coefficient ρ* and the Euclidean distance error. Again, the negative coefficients ρ*s were plotted at ρ*=0. Most points are clustered in the lower-right corner of the plot. Two outliers, nodule A and nodule B as circled in the plot, were incorrectly registered. As will be discussed in the next section, registration for nodule A fails due to 3D rigid affine transformation and template matching and nodule B fails due to template matching.
B. Volume overlap ratio
Figure 10(a) illustrates the distribution of the volume overlap ratio r. Of the 101 pairs, 99 registered nodule VOIs had nonzero overlap with their ground truth VOIs and 83 pairs had ratios greater than 0.5. This result indicates that our automated nodule registration can be useful in locating the target nodules based on source nodule positions. The nodules that had zero overlap are again nodule A and nodule B, the same outliers that had a large Euclidean distance error as shown in Fig. 10(c). Figure 10(b) shows the scatter-plot of the volume overlap ratio and the cross-correlation coefficients. The negative correlation coefficients were plotted at ρ*=0. Most points cluster in the upper-right corner of the plot. A nodule that has a high cross-correlation coefficient typically also has a high volume overlap ratio. Figure 10(c) illustrates the scatter-plot of the volume overlap ratio and the Euclidean distance error. As expected, the nodules that have small Euclidean distance errors generally have high overlap ratios. However, for a given Euclidean distance, e.g., 5 mm, the volume overlap ratio can range from about 0.1 to 0.7, indicating that the Euclidean distance alone does not describe clearly the registration performance.
Fig. 10.
(a) Histogram of the volume overlap ratios. Only the outliers nodule A and nodule B have zero overlap. (b) The scatter-plot of the volume overlap ratios and the cross-correlation coefficients. A nodule with a high cross-correlation coefficient typically has a high volume overlap ratio. (c) Scatter-plot of the Euclidean distance error and the volume overlap ratio. The two outliers nodule A and nodule B have large distance errors and zero overlap.
We also investigated the effects of the Hessian response and the geometric constraint on the Euclidean distance error. When the Hessian response constraint alone was lifted, i.e., when search was conducted for all voxels in Ω, but the geometric constraint was still applied, the Euclidean distance error was 2.9±4.6 mm. When the geometric constraint alone was lifted, the Euclidean distance error was 3.1±4.9 mm. When both of the constraints were lifted, the Euclidean distance error was 3.5±6.3 mm.
C. Hit rate
The initial registration had very low hit rate. Out of 101 nodules, only 28 nodules had their registered centers fall into the ground truth VOIG’s identified by the radiologist. The second stage by template matching improved the hit rate to 93/101. The hit rate is insensitive to the Hessian and geometric constraints, indicating that this measure is a very rough estimate of the registration performance.
IV. DISCUSSION
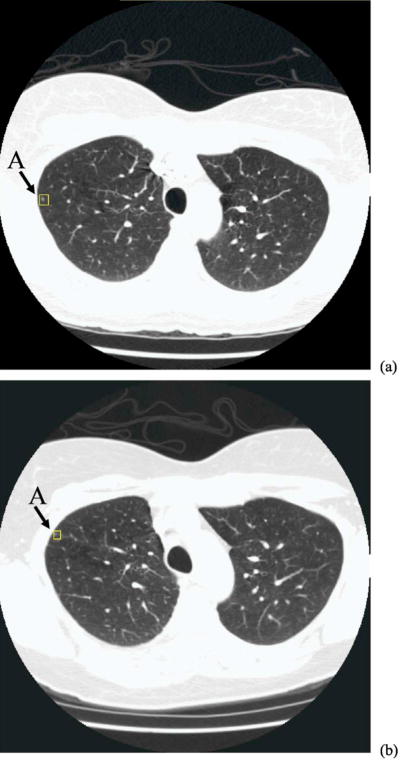
Our results indicate that the two-step registration method performs well for most nodule pairs. The initial nodule registration based on the rib anatomy and the rigid 3D affine transformation can localize the corresponding nodule to within a small region in the target CT scan and the second-stage nodule template matching can be confined to this region. This approach greatly reduces the chance of mismatching and also improves the computational efficiency. The average Euclidean distance error after 3D affine transformation was 9.7±5.5 mm. However, the position of nodule relative to the ribs may have a significant change from the source CT scan to the target CT scan due to positioning or other factors. Figure 11 shows such an example, where the nodule is enclosed by a rectangular box in the source [Fig. 11(a)] and the target [Fig. 11(b)] scans of the same patient, acquired 4 months apart in time. The nodule diameter is less than 3 mm. A chest radiologist verified that the two lesions in Figs. 11(a) and 11(b) are most likely the same nodule, even though they appear at different locations relative to the adjacent ribs. The 3D local rigid affine transformation that exploits the anatomical points on the rib centerline was unable to appropriately register nodule A, resulting in a large Euclidean distance error of about 23 mm. Although the target nodule was included in the search region, template matching incorrectly matched this small nodule to a non-nodule structure with a high cross-correlation coefficient of 0.79. This structure did not satisfy the geometrical constraint so that the final position remained the same as that from the initial registration where there was no nodulelike structure so that the cross-correlation coefficient was very low. The large misregistration thus was caused by both the initial registration and template matching.
Fig. 11.
Two CT scans of the same patient, acquired at an interval of 4 months: (a) source scan and (b) target scan. Nodule A was identified by an experienced chest radiologist as marked by the box in each image. This is a small juxta-pleural nodule and there is apparently a significant location change between the two scans. Nodule A is one of the outliers that was misregistered in our study.
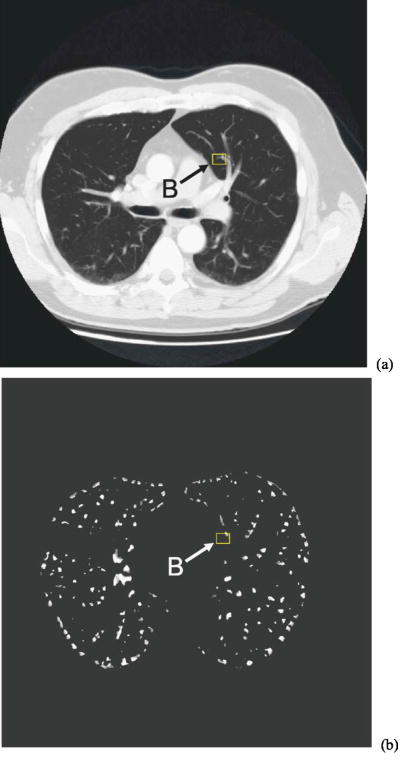
Template matching with the Hessian constraint may be helpful in many cases. However, there are also cases in which the use of the Hessian response may be detrimental. One such case is shown in Fig. 12, where the shape of nodule B is distorted by the neighboring vascular structure, and the Hessian response in the core part of the nodule is lower than the threshold Th. Although some peripheral voxels in the nodule VOI have Hessian responses larger than Th, their cross-correlation coefficients were all small. As a result, an incorrect position (in a slice different than that shown in Fig. 12) with a Hessian response larger than Th and a larger cross-correlation coefficient was selected as the corresponding nodule location.
Fig. 12.
The CT image in the target scan and the Hessian response for the outlier nodule B, identified by the box in each image. Notice that the nodule is small with a diameter of 5.2 mm and its shape is distorted by the neighboring vessels. Nodule B is one of the outliers that was misregistered in our study.
Our study also shows that registering small juxta-pleural nodules is a challenging task as found by other researchers. To some extent, we have overcome this challenge by using the geometrical constraint that effectively reflects the expectation that the distance between the nodule center and the lung surface in the source scan cannot be very different from that in the target scan. This constraint reduced the average Euclidean distance error from 3.1±4.9 to 2.7±3.3 mm.
In this study, we used the prior exam as the source scan and the current exam as the target scan. However, the method is applicable if the roles of the prior and current exams are reversed. Because VOIT has the same volume as VOIG marked in the prior CT scan, if a nodule decreases in size in the current scan, the volume overlap ratio γ will be optimistically biased. Conversely, γ is pessimistically biased for growing nodules. Figure 8 shows that the size of most nodules in this study either remains unchanged or increases from the source to the target scan. The estimated performance of the registration system in terms of γ is therefore conservative.
Limitations of our registration approach included the following. First, our technique may have a large error for nodules that appear on the source scan, but not on the target scan. For such nodules, template matching would likely fail, and the initial nodule registration would therefore be crucial. Improvement of the initial nodule registration based on reliable anatomical structures and effective geometrical transformations is worth further investigation. A second limitation of our technique is the requirement that both the target and source scans cover the entire lung. Partial thoracic CT scans of a patient may result in inconsistent rib labeling on the two scans and cause the rigid affine registration using the rib anatomy to fail. Registration of lung nodules on partial thoracic CT scans would be an interesting topic for further study. Finally, for rib labeling, we assume that compared to other rib pairs, the axial slices on which the second rib pair joins the spine are closer to the apex of the lungs. This assumption was correct for all 48 CT scans used in this study, but it is likely that there will be scans for which this assumption does not hold. However, even when this assumption is not satisfied, if the labeling of the ribs is consistent for the two temporal scans of a patient (e.g., if the labels for both scans are shifted together by any number, i.e., the nth rib pair instead of the second rib pair appears on the axial slice with the lung apex), the subsequent steps of nodule registration will not be adversely affected.
V. CONCLUSION
We have developed an automated method to identify corresponding nodules in serial CT scans for interval change analysis. Our quantitative study indicates that it is possible to accurately predict the location of a lesion on a target scan based on its location on a source scan. Our registration technique achieved a Euclidean distance error of less than 5 mm for 85% and less than 10 mm for 99% of the nodules in our data set. The results indicated that our approach may be useful as a foundation for the development of an automated system to perform computer-assisted interval change analysis for lung nodules in series CT scans. We are continuing to increase the size of our temporal nodule data set to investigate the generalizability of the approach developed in this study. Investigation is also underway to compare the computer-segmented nodule volume in the source scan to that in the computer-identified volume of interest in the target scan for estimation of nodule growth.
Acknowledgments
This work is supported by a USPHS Grant No. CA93517.
References
- 1.“Cancer statistics 2006 presentation,” www.cancer.org
- 2.American Cancer Society. Cancer Facts & Figures 2005 2005 www.cancer.org.
- 3.Sone S, et al. Results of three-year mass screening programme for lung cancer using mobile low-dose spiral computed tomography scanner. Br J Cancer. 2001;84:25–32. doi: 10.1054/bjoc.2000.1531. [DOI] [PMC free article] [PubMed] [Google Scholar]
- 4.Nawa T, Nakagawa T, Kusano S, Kawasaki Y, Sugawara Y, Nakata H. Lung cancer screening using low-dose spiral CT: Results of baseline and 1-year follow-up studies. Chest. 2002;122:15–20. doi: 10.1378/chest.122.1.15. [DOI] [PubMed] [Google Scholar]
- 5.Li Q, Sone S, Doi K. Selective enhancement filters for nodules, vessels, and airway walls in two- and three-dimensional CT scans. Med Phys. 2003;30:2040–2051. doi: 10.1118/1.1581411. [DOI] [PubMed] [Google Scholar]
- 6.Dodd LE, et al. Assessment methodologies and statistical issues for computer-aided diagnosis of lung nodules in computed tomography: contemporary research topics relevant to the lung image database consortium. Acad Radiol. 2004;11:462–475. doi: 10.1016/s1076-6332(03)00814-6. [DOI] [PubMed] [Google Scholar]
- 7.Gurcan MN, Sahiner B, Petrick N, Chan HP, Kazerooni EA, Cascade PN, Hadjiiski L. Lung nodule detection on thoracic computed tomography images: Preliminary evaluation of a computer-aided diagnosis system. Med Phys. 2002;29:2552–2558. doi: 10.1118/1.1515762. [DOI] [PubMed] [Google Scholar]
- 8.Ge Z, Sahiner B, Chan HP, Hadjiiski LM, Cascade PN, Bogot N, Kazerooni EA, Wei J, Zhou C. Computer aided detection of lung nodules: false positive reduction using a 3D gradient field method and 3D ellipsoid fitting. Med Phys. 2005;32:2443–2454. doi: 10.1118/1.1944667. [DOI] [PMC free article] [PubMed] [Google Scholar]
- 9.Sluimer I, Schilham A, Prokop M, van Ginneken B. Computer analysis of computed tomography scans of the lung: a survey. IEEE Trans Med Imaging. 2006;25:385–405. doi: 10.1109/TMI.2005.862753. [DOI] [PubMed] [Google Scholar]
- 10.Way TW, Hadjiiski LM, Sahiner B, Chan HP, Cascade PN, Kazerooni EA, Bogot N, Zhou C. Computer-aided diagnosis of pulmonary nodules on CT scans: Segmentation and classification using 3D active contours. Med Phys. 2006;33:2323–2337. doi: 10.1118/1.2207129. [DOI] [PMC free article] [PubMed] [Google Scholar]
- 11.Summers RM. Road maps for advancement of radiologic computer-aided detection in the 21st century. Radiology. 2003;229:11–13. doi: 10.1148/radiol.2291030010. [DOI] [PubMed] [Google Scholar]
- 12.Shapiro LG, Stockman GC. Computer Vision. Englewood Cliffs, NJ: Prentice-Hall; 2001. [Google Scholar]
- 13.BookStein FL. Principal warps: Thin-plate splines and the decomposition of deformations. IEEE Trans Pattern Anal Mach Intell. 1989;11:567–585. [Google Scholar]
- 14.Maes F, Collignon A, Vandermeulen D, Marchal G, Suetens P. Multimodality image registration by maximization of mutual information. IEEE Trans Med Imaging. 1997;16:187–198. doi: 10.1109/42.563664. [DOI] [PubMed] [Google Scholar]
- 15.Pluim JPW, Antoine Maintz JB, Viergever MA. Mutual-information-based registration of medical images: A survey. IEEE Trans Med Imaging. 2003;22:986–1004. doi: 10.1109/TMI.2003.815867. [DOI] [PubMed] [Google Scholar]
- 16.Betke M, Hong H, Thomas D, Prince C, Ko JP. LandmArk detection in the chest and registration of lung surfaces with an application to nodule registration. Med Image Anal. 2003;7:265–281. doi: 10.1016/s1361-8415(03)00007-0. [DOI] [PubMed] [Google Scholar]
- 17.Besl PJ, Mckay ND. A method for registration of 3-D shapes. IEEE Trans Pattern Anal Mach Intell. 1992;14:239–256. [Google Scholar]
- 18.Hong H, Lee J, Lee KW, Shin YG. Automatic lung surface registration using selective distance measure in temporal CT scans. Proceedings of Iberoamerican Congress on Pattern Recognition; 2004. pp. 517–524. [Google Scholar]
- 19.Hong H, Lee J, Shin YG. Automatic lung nodule mathching for the follow-up in temporal chest CT scans. Proc SPIE. 2006;6144:1–9. [Google Scholar]
- 20.Blaffert T, Wiemker R. Comparison of different follow-up lung registration methods with and without segmentation. Proc SPIE. 2004;5370:1701–1708. [Google Scholar]
- 21.Sun S, Rubin G, Napel S. A semi-rigid model for lung nodule registration in computed tomography (CT) scans. RSNA; Chicago: 2005. [Google Scholar]
- 22.Reeves AP, Chan AB, Yankelevitz DF, Henschke CI, Kressler B, Kostis WJ. On measuring the change in size of pulmonary nodules. IEEE Trans Med Imaging. 2006;25:435–450. doi: 10.1109/TMI.2006.871548. [DOI] [PubMed] [Google Scholar]
- 23.Shen H, Liang L, Shao M, Qing S. Tracing based segmentation for the labeling of individual rib structures in chest CT volume data. Proceedings of MICCAI. 2004:967–974. [Google Scholar]
- 24.Staal J, Ginneken BV, Viergever MA. Automatic rib segmentation in CT data. Proceedings of CVAMIA-MMBIA. 2004:193–204. [Google Scholar]
- 25.Wang LI, Greenspan M, Ellis R. Validation of bone segmentation and improved 3-D registration using contour coherency in CT data. IEEE Trans Med Imaging. 2006;25:324–334. doi: 10.1109/TMI.2005.863834. [DOI] [PubMed] [Google Scholar]
- 26.Zhou C, Chan HP, Patel S, Cascade PN, Sahiner B, Hadjiiski LM, Kazerooni EA. Preliminary investigation of computer-aided detection of pulmonary embolism in 3D computed tomographic pulmonary angiography (CTPA) images. Acad Radiol. 2005;12:782–792. doi: 10.1016/j.acra.2005.01.014. [DOI] [PMC free article] [PubMed] [Google Scholar]
- 27.Schroeter P, Vesin JM, Langenberger T, Meuli R. Robust parameter estimation of intensity distributions for brain magnetic resonance images. IEEE Trans Med Imaging. 1998;17:172–186. doi: 10.1109/42.700730. [DOI] [PubMed] [Google Scholar]
- 28.Gonzalez RC, Woods RE. Digital Image Processing. 2. Prentice-Hall; Englewood Cliffs, NJ: 2002. [Google Scholar]
- 29.Nelder JA, Mead R. A simplex-method for function minimization. Comput J. 1965;7:308–313. [Google Scholar]
- 30.Horn BKP. Closed-form solution of absolute orientation using unit quaternions. J Opt Soc Am A. 1987;4:629–642. [Google Scholar]
- 31.Nakayama R, Uchiyama Y, Yamamoto K, Watanabe R, Namba K. Computer-aided diagnosis scheme using a filter bank for detection of microcalcification clusters in mammograms. IEEE Trans Biomed Eng. 2006;53:273–283. doi: 10.1109/TBME.2005.862536. [DOI] [PubMed] [Google Scholar]
- 32.Sahiner B, Ge Z, Chan H, Hadjiiski LM, Bogot N, Cascade P, Kazerooni E. False positive reduction using Hessian features in computer-aided detection of pulmonary nodules on thoracic CT images. Proc SPIE. 2005;5747:790–795. [Google Scholar]
- 33.Sato Y, Nakajima S, Shiraga N, Atsumi H, Yoshida S, Koller T, Gerig G, Kikinis R. Three-dimensional multi-scale line filter for segmentation and visualization of curvilinear structures in medical images. Med Image Anal. 1998;2:143–169. doi: 10.1016/s1361-8415(98)80009-1. [DOI] [PubMed] [Google Scholar]
- 34.Sahiner B, Chan HP, Hadjiski LM, Cascade PN, Bogot NR, Kazerooni EA, Zhou C. Computerized lung nodule detection on screening CT scans: Performance improvement using Hessian features and an artificial neural network classifier. RSNA; Chicago: 2005. [Google Scholar]
- 35.Schreibmann E, Xing L. Image registration with auto-mapped control volumes. Med Phys. 2006;33:1165–1179. doi: 10.1118/1.2184440. [DOI] [PubMed] [Google Scholar]
- 36.Wilson CA, Theriot JA. A correlation-based approach to calculate rotation and translation of moving cells. IEEE Trans Image Process. 2006;15:1939–1951. doi: 10.1109/tip.2006.873434. [DOI] [PubMed] [Google Scholar]
- 37.Filev P, Hadjiiski LM, Sahiner B, Chan HP, Helvie MA. Comparison of similarity measures for the task of template matching of masses on serial mammograms. Med Phys. 2005;32:515–529. doi: 10.1118/1.1851892. [DOI] [PubMed] [Google Scholar]


