
Fig. 1.
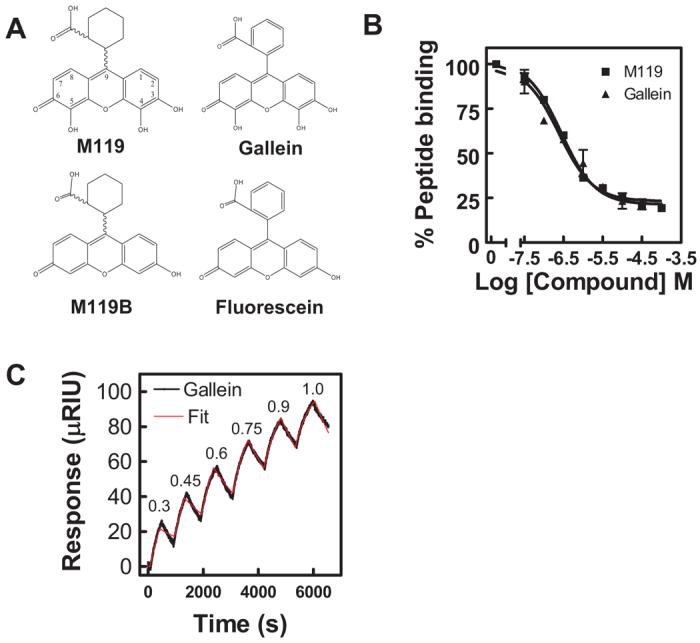
Small molecule binding profiles. A, structures of M119, M119B, gallein, and fluorescein are shown. B, M119 and gallein bind with comparable affinities in the competition phage ELISA. M119 and gallein were tested for their ability to inhibit binding of a phage displaying the peptide SIGK to the Gβγ “hot spot” as described previously (Bonacci et al., 2006). Data shown is representative of three independent experiments, each in duplicate, ± S.D. C, direct binding analysis of gallein bind to Gβγ by SPR. A representative experiment for gallein binding to bGβ1γ2. Gallein binding was tested at sequentially higher micromolar concentrations indicated at the peak of each association followed by a dissociation phase with the compound removed between each addition. All data were fit with a kinetic titration model (Karlsson et al., 2006) to give ka and kd values. In the experiment shown, the fits resulted in ka = 1130 ± 17 M−1 s−1 and k = 4.3 ± 0.04 × 10⁻⁴ s−1. Pooled data from three separate experiments are given in Table 1.