
Figure 4. OPG vs. BP inhibition of Ceridust-induced osteolysis assessed by histology.
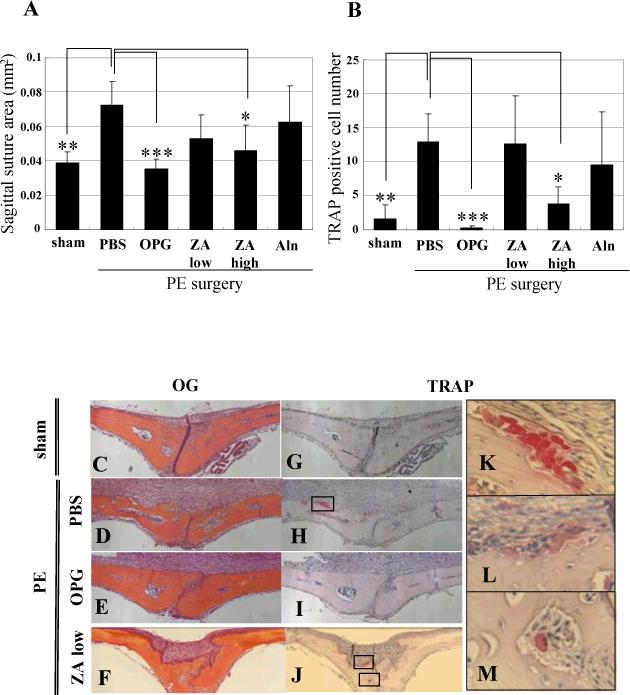
After the day 10 in vivo micro-CT scans, the mice described in Figure 3 were sacrificed and their calvaria were harvested for Orange/G and TRAP stained histology to quantify the SSA (A) and osteoclast numbers (B) as described in Figure 1. The data are presented as the mean +/− SD (* p<0.05, ** p<0.01, *** p<0.001 vs. PBS control in Tukey test). Representative Orange/G (C-F) and TRAP (G-M) stained histology are presented at 100X (C-J). High power images of the boxed regions in H and J are also shown at 400X (K-M). Of note are the large number of active osteoclasts in the PBS group (H & K), the complete absence of osteoclasts in the OPG group (I) and the presence of both active (L) and apoptotic (M) osteoclasts in the low dose ZA group.