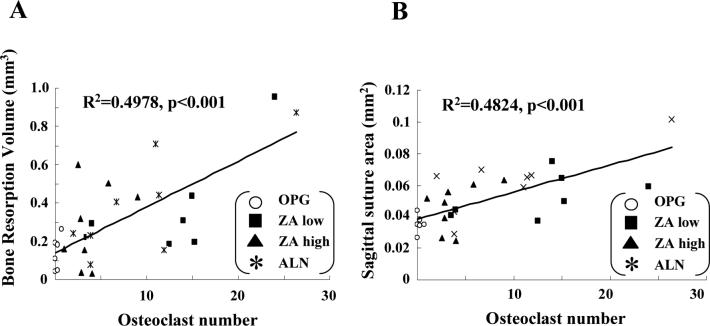
Figure 5. Differences in osteolysis between OPG vs. BP treated mice correlate with osteoclast number.
Linear regression analyses were performed to assess the relationship between osteolysis determined by 3D micro-CT in Figure 3B (A) and 2D histomorphometry in Figure 4A (B), versus the number of osteoclasts in Figure 4B.

