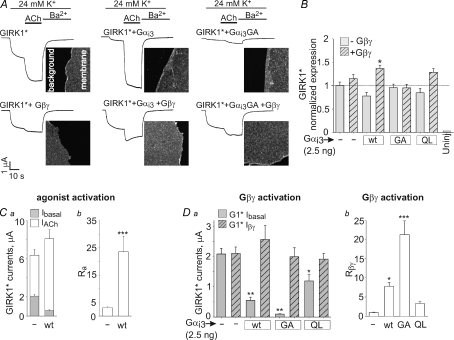
Figure 6. Gαi3 regulates GIRK1* activation in whole oocytes.
A, examples of basal and ACh-evoked currents (continuous lines) of GIRK1* (10–15 ng), with and without coexpression of Gα (2.5 ng) and Gβγ (5 and 1 ng RNA, respectively). The images beside the current traces show the PM expression of GIRK1*, monitored in giant excised PM patches using anti-GIRK1 antibody and a secondary, fluorescently labelled antibody. The images focus on the edges of the PM patches to allow comparison with the background. The image area is 55 × 55 μm. B, summary of GIRK1* expression levels under different conditions. n= 14–19. C, summary of Ibasal and IACh with or without coexpression of Gαi3-wt (2.5 ng RNA per oocyte) (a), and of Ra measured in the same oocytes (b). n= 22–30. D, the effect of coexpression of Gαi3 (wt, GA or QL, 2.5 ng each) on GIRK1*'s Ibasal and Iβγ (a), and the summary of measurements of Rβγ in this series of experiments (b). n= 17–36. Statistical comparisons of multiple groups were done using one-way ANOVA followed by Dunnett's test against the control group, GIRK1* alone.*P < 0.05; **P < 0.01; ***P < 0.001.

