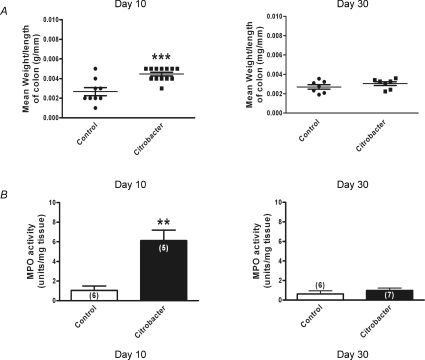
Figure 2. Monitoring of C. rodentium colitis.
A, scatter plot of colonic wet weight during active infection (day 10) (n= 13 animals for C. rodentium and 9 animals for control); ***P < 0.0002 and following resolution (day 30) of infection (n= 7 animals for both C. rodentium and control). The lines show the mean ±s.e.m. for each treatment group. B, increased MPO activity was detected during acute infection (day 10) in tissue samples from C. rodentium infected animals (filled bars) compared to controls (open bars), whereas levels were comparable to control values on resolution of the infection (day 30). Data are mean ±s.e.m. values; **P < 0.005.

