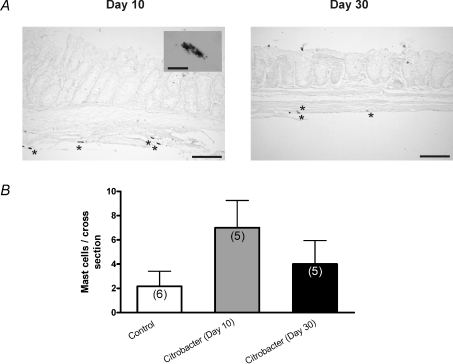
Figure 4. Assessment of mast cell numbers at day 10 and 30 following C. rodentium infection.
A, representative photomicrographs of Toluidine Blue stained colonic tissue sections illustrating intact mast cells during active infection (day 10) and following infection resolution (day 30). Scale bar = 100 μm. Inset image shows cytoplasmic granular staining of individual mast cells (scale bar = 10 μm). B, summary of data (n= 3 sections from 5 colons) showing numbers of mast cells stained per section of colon at day 10 and day 30. Control samples from day 10 and 30 were combined. P= 0.09 comparing control and day 10 tissues (Mann–Whitney test).

