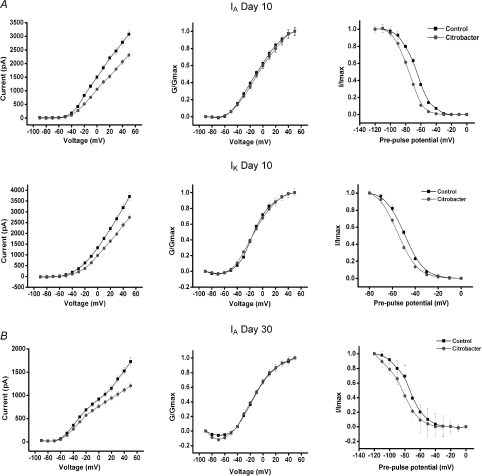
Figure 6. Effect of C. rodentium induced colitis on the current–voltage relationship and the steady-state activation and inactivation of IA and IK at the height of infection (day 10) and on resolution (day 30).
A, correlation of the current–voltage relationship for IA (upper left panel) and IK (middle left panel) showing significantly decreased currents by C. rodentium colitis near the resting membrane potential. Upper and middle central panels illustrate the steady-state activation curves for IA and IK from control and infected animals. Means ±s.e.m. of normalized conductance (G/Gmax) were plotted against membrane potential. Data were fitted using Boltzmann function, and continuous lines show best fits. The upper and middle right panels show the steady-state inactivation curves for both currents in neurons from C. rodentium infected animals and controls. The curves were obtained by plotting the normalized test current amplitudes against conditioning pre-pulse potentials. C. rodentium induced colitis caused a leftward shift in the steady-state inactivation curves for both IA (upper right panel) and IK (middle right panel). B, at day 30, C. rodentium induced colitis also significantly decreased IA currents near the resting membrane potential (lower left panel). The steady-state activation kinetics of IA was not altered (lower middle panel). However, the steady-state inactivation curve for IA currents (lower right panel) in neurons from C. rodentium treated animals shifted to the left (hyperpolarizing shift) when compared to controls.

