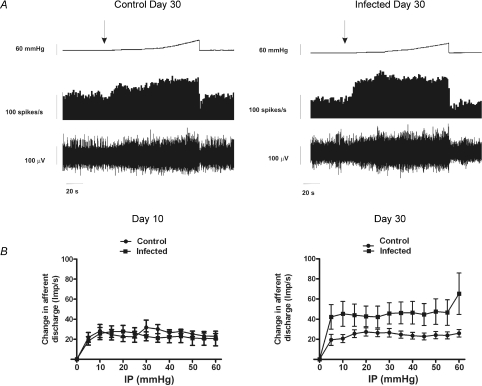
Figure 7. Assesment of visceral mechanosensitivity.
A, representative trace showing pelvic nerve afferent activity (spikes s−1) in response to a ramp distension in 30 days control or 30 day infected mice. Top traces, ramp distension; second trace, afferent activity rate; bottom trace, raw recording of whole nerve activity. B, pressure–response profiles of multi-unit activity from 10 and 30 days controls or infected animals. The pressure-response profile was significantly augmented at day 30 compared to controls (P < 0.001 for all measurement points, two-way ANOVA with Bonferoni's correction). Left: day 10 animals (n= 10); right: day 30 animals (n= 9). Data are means ±s.e.m. per treatment group.

